-150- v2.9
Sensors
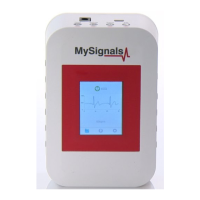
You can see in this screen a color code in the sensor logos:
• Green: It is a real- time value measured in MySignals Software
• Orange: It is a old value measured in a previously connection of some time ago.
• Grey: It is that the sensor is not connected.
Figure: General mode Web Server
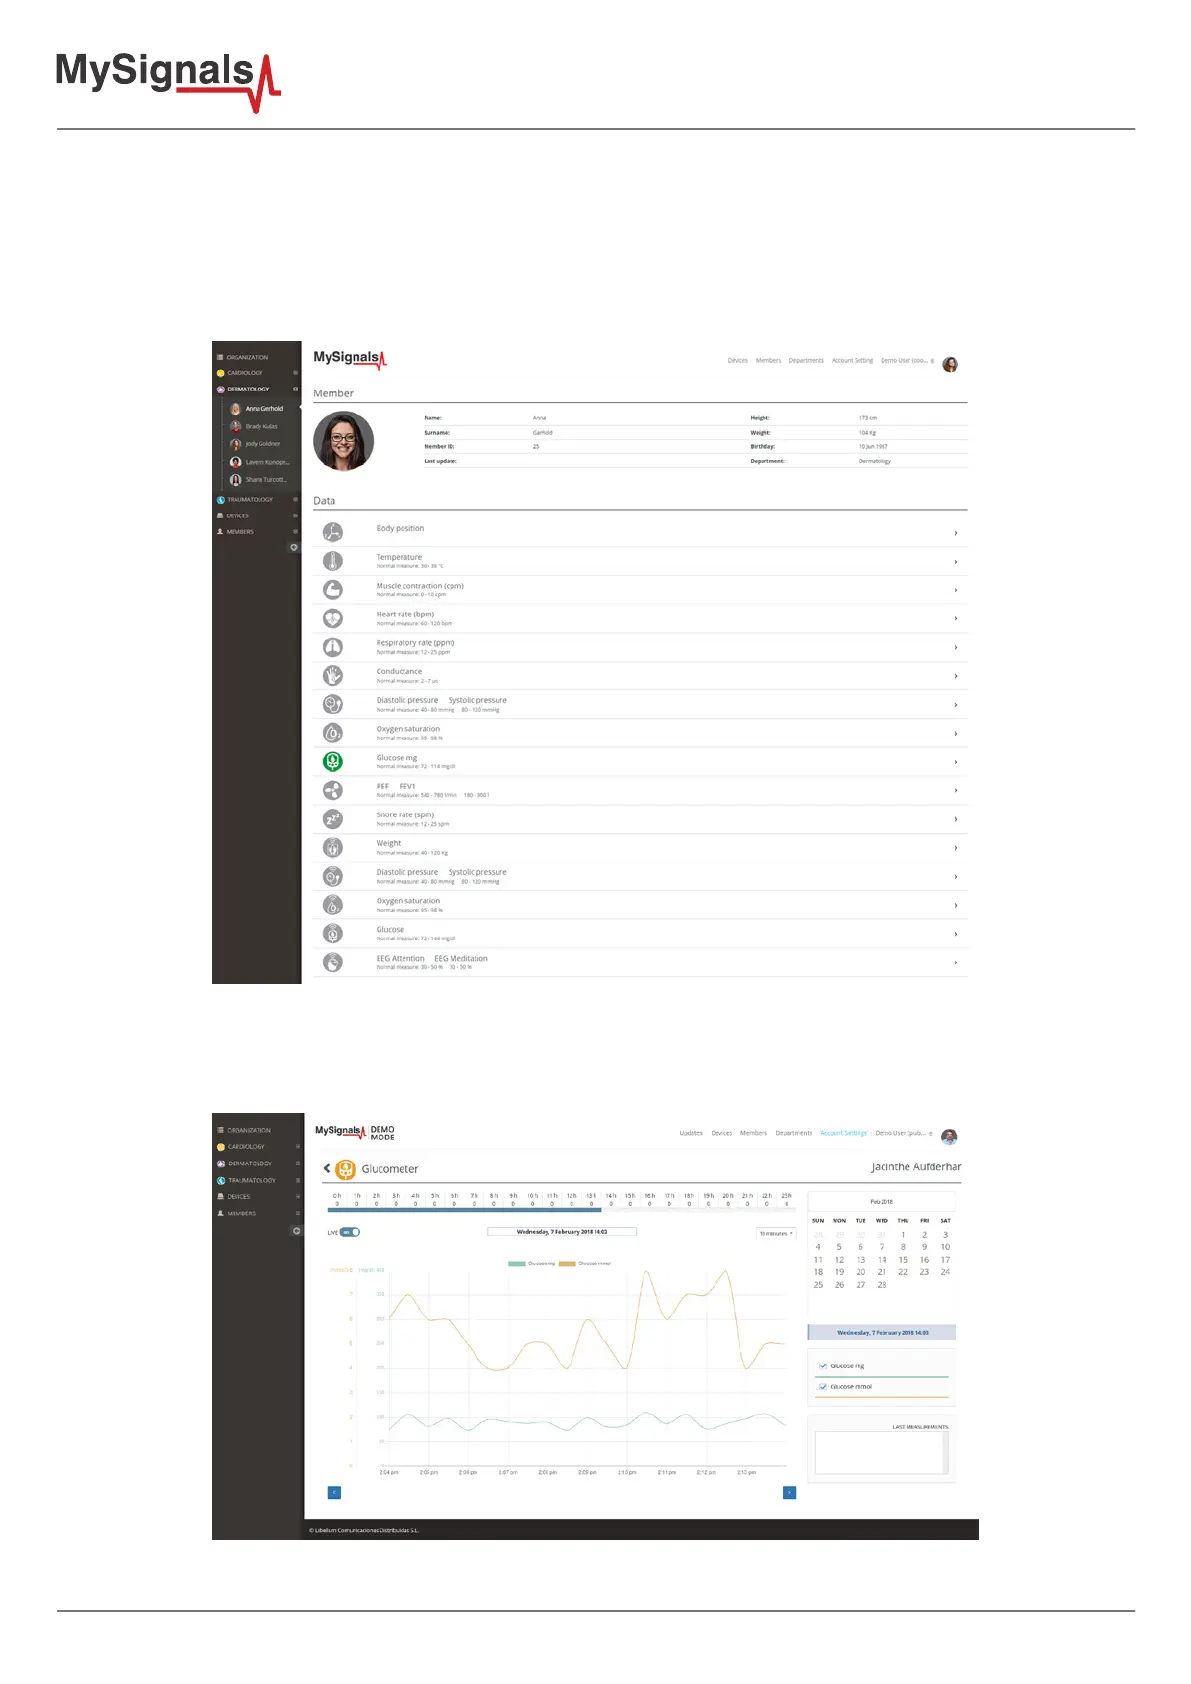
Finally, you can go to detail mode for each sensor selected. Press in the logo of the sensor in General Mode if you
want to see the graphical and numeric values of a specic sensor.
Figure: Detail mode Web Server