-213- v2.9
Sensors
MySignals Web Server
This is an example of sensor viewing in MySignals Web Server Mode.
First of all choose the sensor that you want to visualize. fast menu situated in the left side of the Web Server.
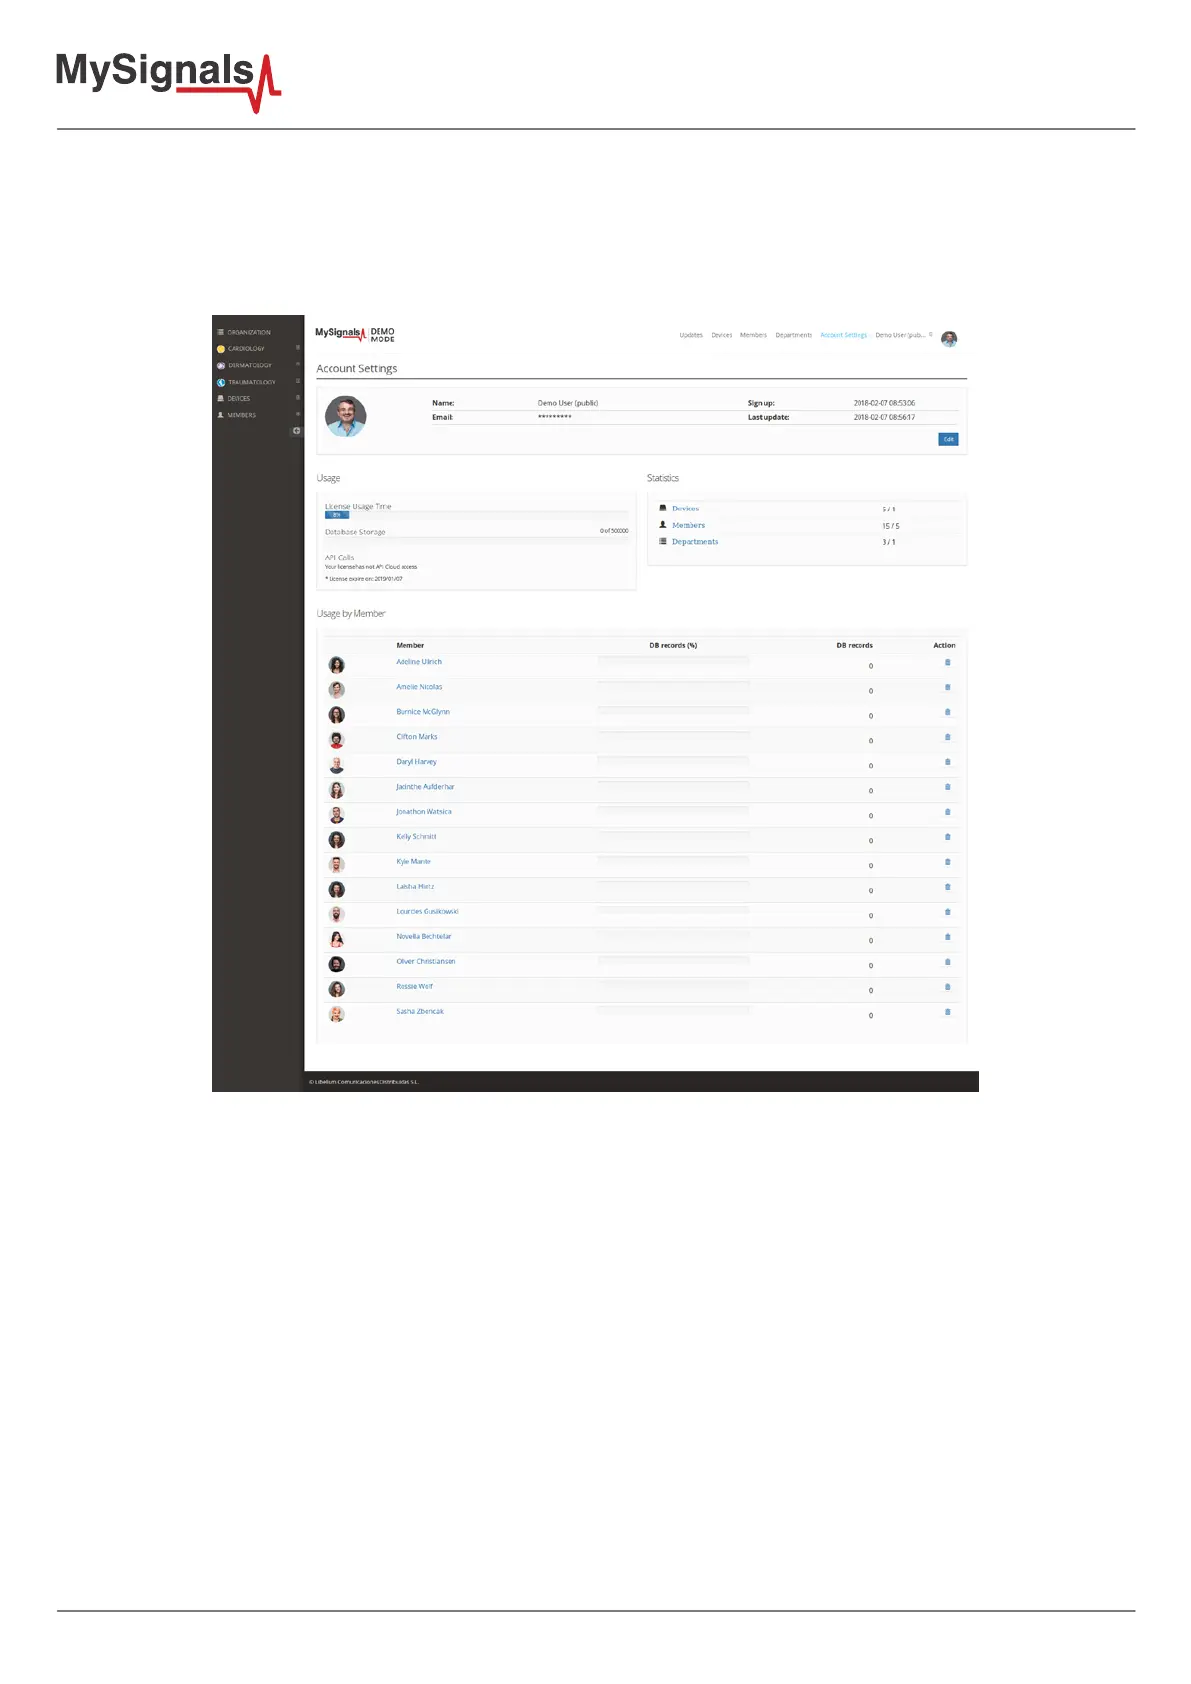
Choose an user.
Figure: Select user
Then you can see the General Sensor page. MySignals Web Server will monitor all the parameters in General Mode
where it only show numeric values.
You can see in this screen a color code in the sensor logos:
• Green: It is a real- time value measured in MySignals Software
• Orange: It is a old value measured in a previously connection of some time ago.
• Grey: It is that the sensor is not connected.