Chapter 5
Advanced Configuration
17
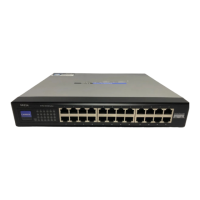
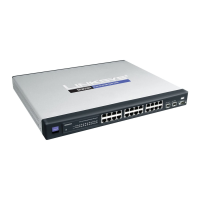
24-Port 10/100 + 2-Port 10/100/1000 Gigabit Advanced Smart Switch with 2 Combo SFPs
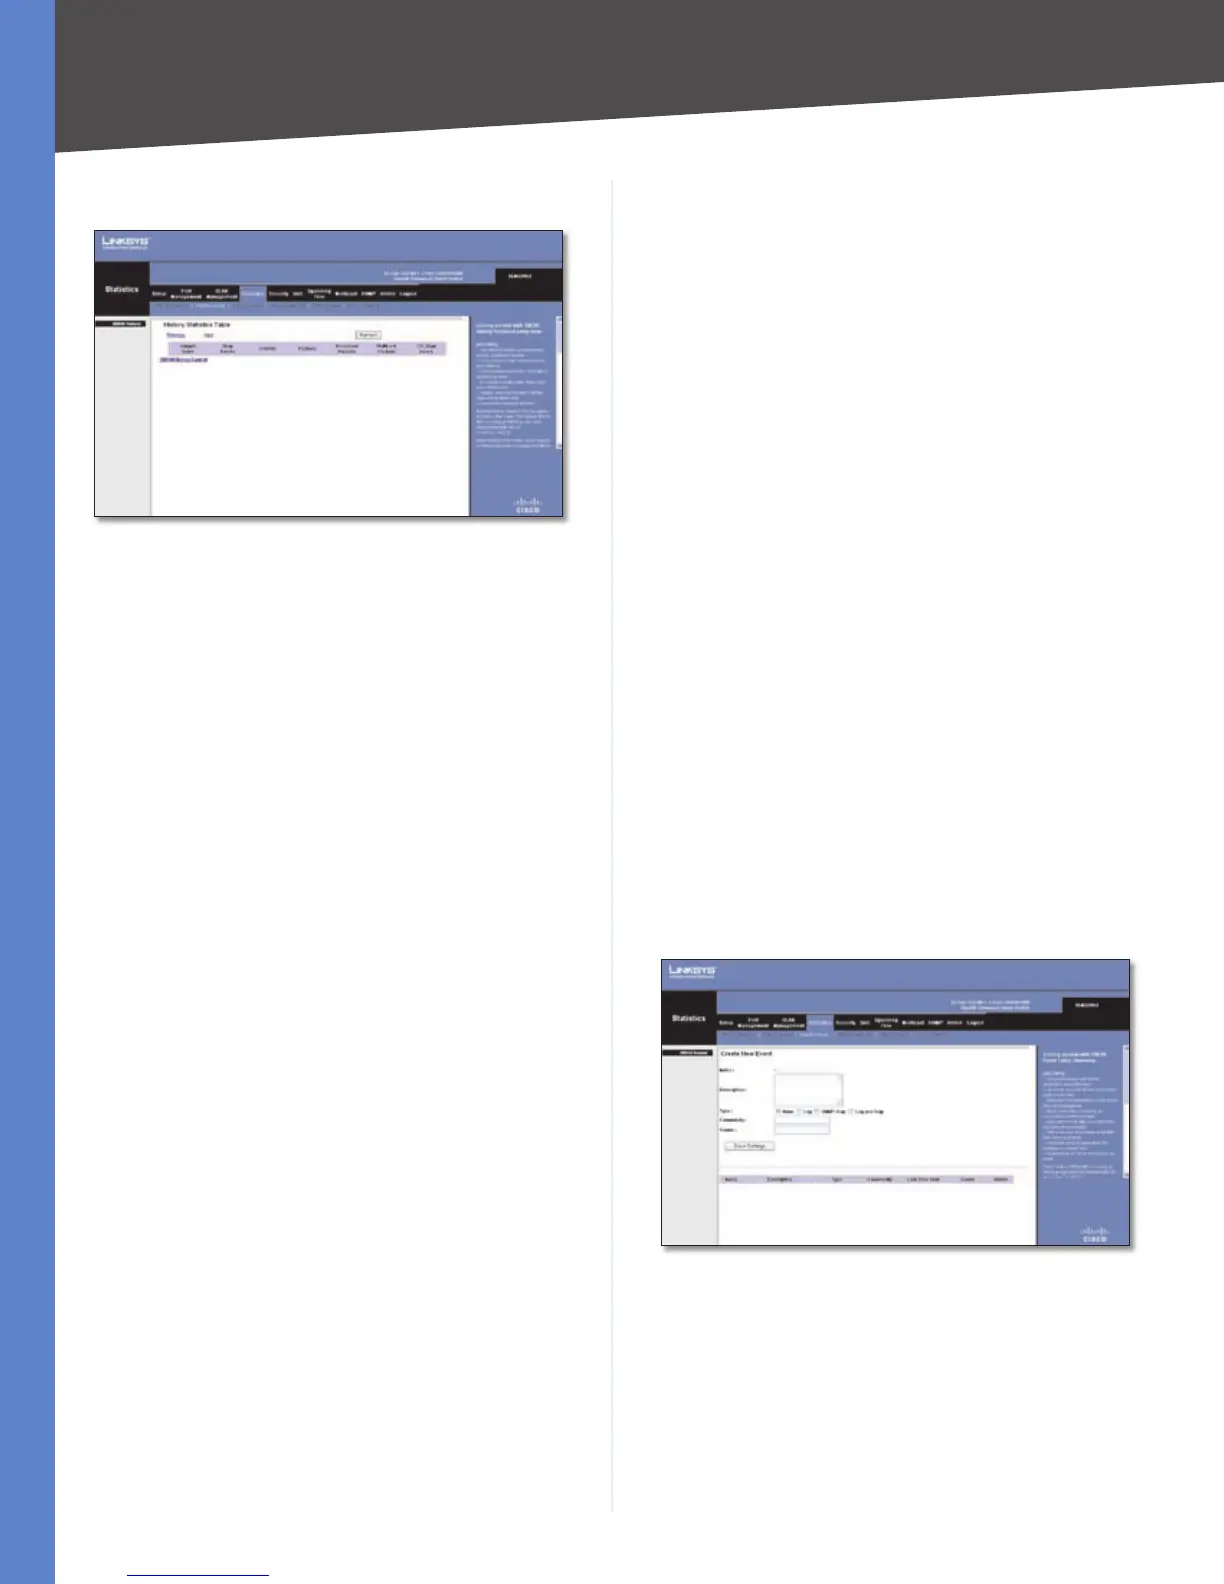
History Statistics Table
History Table
Sample Index Indicates the sample index from which
the statistics were taken.
Drop Events Displays the number of dropped events
that have occurred on the interface since the device was
last refreshed.
Octets Displays the number of octets received on the
interface since the device was last refreshed. This number
includes bad packets and FCS octets, but excludes framing
bits.
Packets Displays the number of packets received on the
interface since the device was last refreshed, including
bad packets, Multicast and Broadcast packets.
Broadcast Packets Displays the number of good
Broadcast packets received on the interface since the
device was last refreshed. This number does not include
Multicast packets.
Multicast Packets Displays the number of good Multicast
packets received on the interface since the device was last
refreshed.
CRC Align Errors Displays the number of CRC and Align
errors that have occurred on the interface since the device
was last refreshed.
Undersize Packets Displays the number of undersized
packets (less than 64 octets) received on the interface
since the device was last refreshed.
Oversize Packets Displays the number of oversized
packets (over 1518 octets) received on the interface since
the device was last refreshed.
Fragments Displays the number of fragments (packets
with less than 64 octets, excluding framing bits, but
including FCS octets) received on the interface since the
device was last refreshed.
Jabbers Displays the total number of received packets
that were longer than 1518 octets. This number excludes
frame bits, but includes FCS octets that had either a bad
Frame Check Sequence (FCS) with an integral number of
octets (FCS Error) or a bad FCS with a non-integral octets
(Alignment Error) number. The field range to detect
jabbers is between 20 ms and 150 ms.
Collisions Displays the number of collision received on
the interface since the device was last refreshed.
Utilization Displays the percentage of the interface
utilized.
Index Displays the history index number.
Source Interface The selected interface on the Switch.
Sampling Requested The number of samples to record.
Current Number of Samples The number of current
samples.
Sampling Interval Displays the interval between taking
samples.
Owner Displays the name of the person who created this
entry.
Status Displays the status of RMON History Control.
Statistics > RMON Events
An RMON Event determines the action to take when an
alarm is triggered. The response to an alarm can include
logging the alarm or sending an SNMP trap message. If
the response corresponding to an alarm has not yet been
defined, use the RMON Event screen to configure the Event
Settings table.
Statistics > RMON Events
Create New Event
Index Displays the event index.
Description Text comments that describes the entry in
the Event Log.
Type Describes the event type. Possible values are:
None Indicates that no event occurred.•
 Loading...