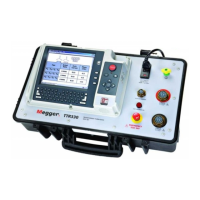
5.22.2 Results Graph
5.22.3 Results Graph Options
When a test completes successfully, a graph of the
% Error will be displayed. A scan line appears over
the current tap position. Min/Max % error of the
y-axis is based on Measurement & Limits setting. If
one of the taps exceeds the allowed percent error,
the Min/Max % error will change and a red band will
be displayed on the graph. The Max phase percent
error appears in the phase options, and individual
phase error will be displayed when the phase option
is changed.
Option Available Settings
Change Test Plan Display
Change winding tap
up or down
All
ØC
ØB
ØC
Primary
Secondary/Tertiary
X-Axis
Phases
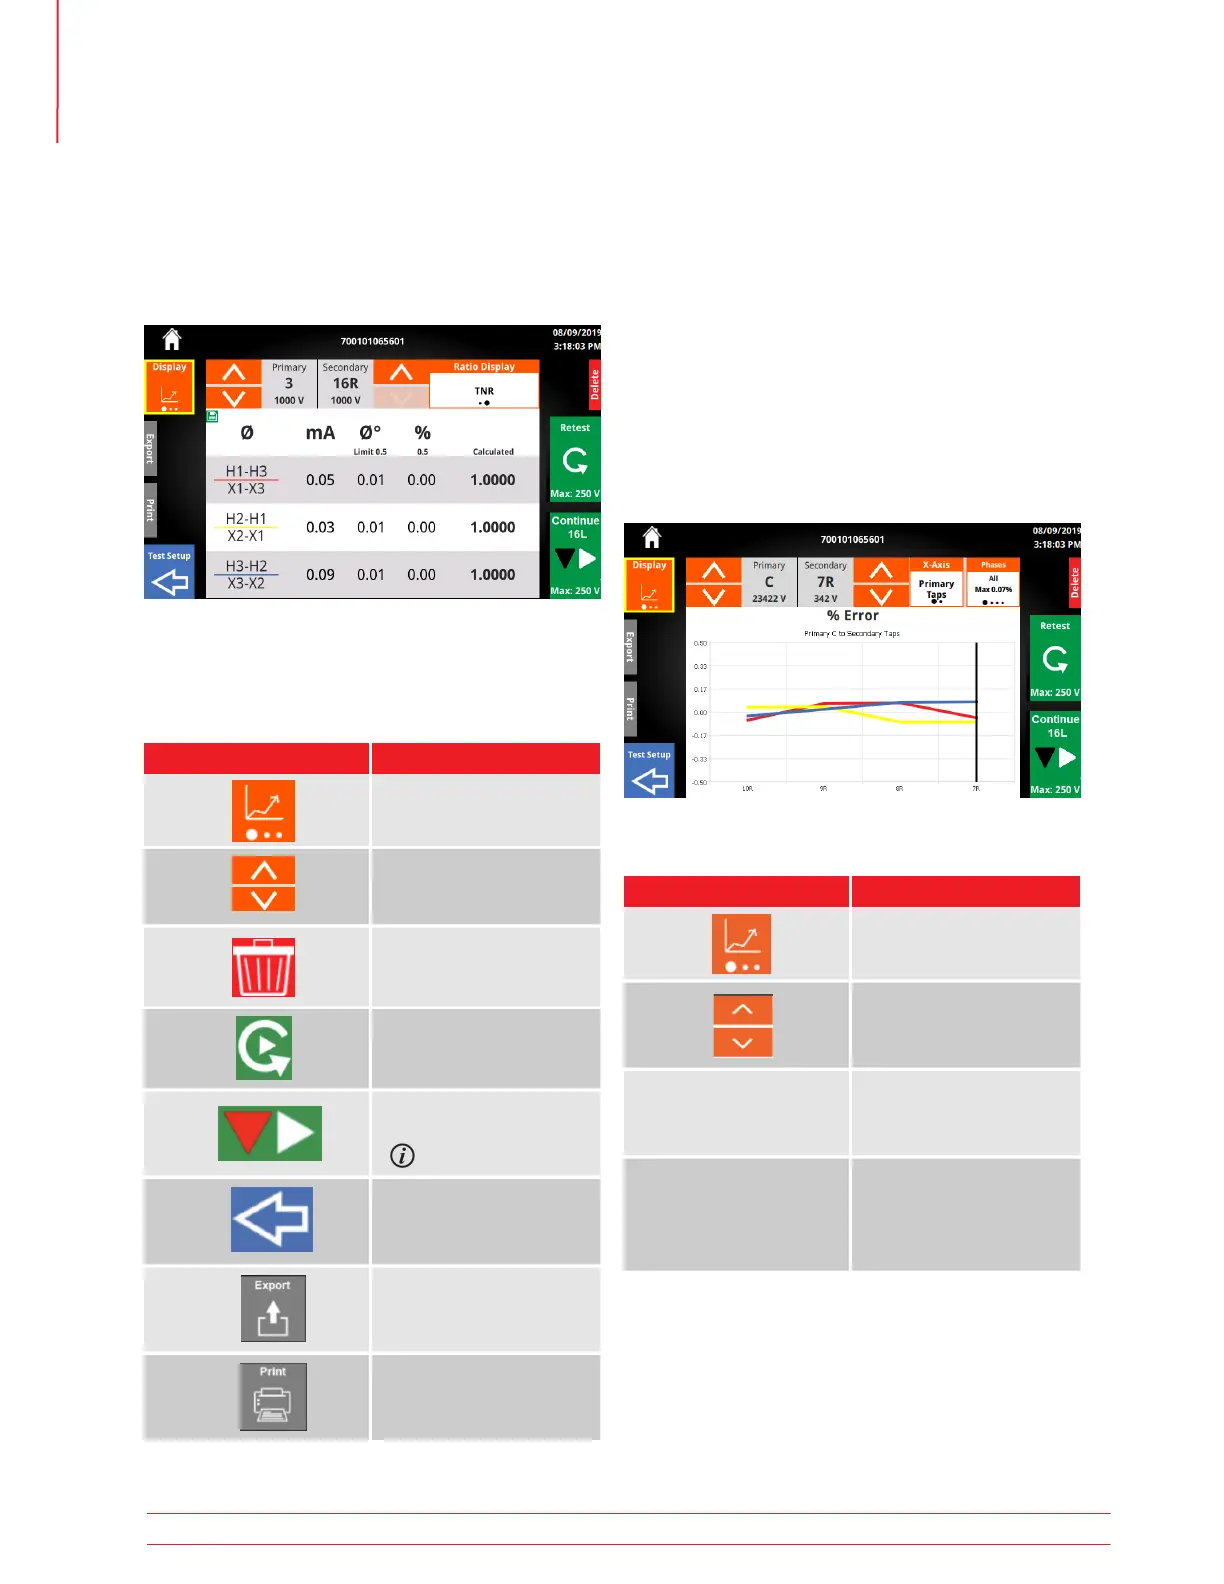
5.22 Test Plan Tap Results
5.22.1 Tap Results Buttons
From a failed test, the tap results will be displayed
after clicking View Results.
Export, Print, Test Setup, and Delete appear mini-
mized. Click the area around the button to expand
the button. Click again to execute action
Button Description
View Failed Results
Retest Tap
Retest Tap
Return to Test Setup
Delete the individual result
Continue - Change Tap
& Test
Export the Test Plan Result
Optional SW Feature
Operation
42 TTRU3 User Manual us.megger.com