Operaon
User Guide
© 2023 Microchip Technology Inc. and its subsidiaries
DS-50003529B - 40
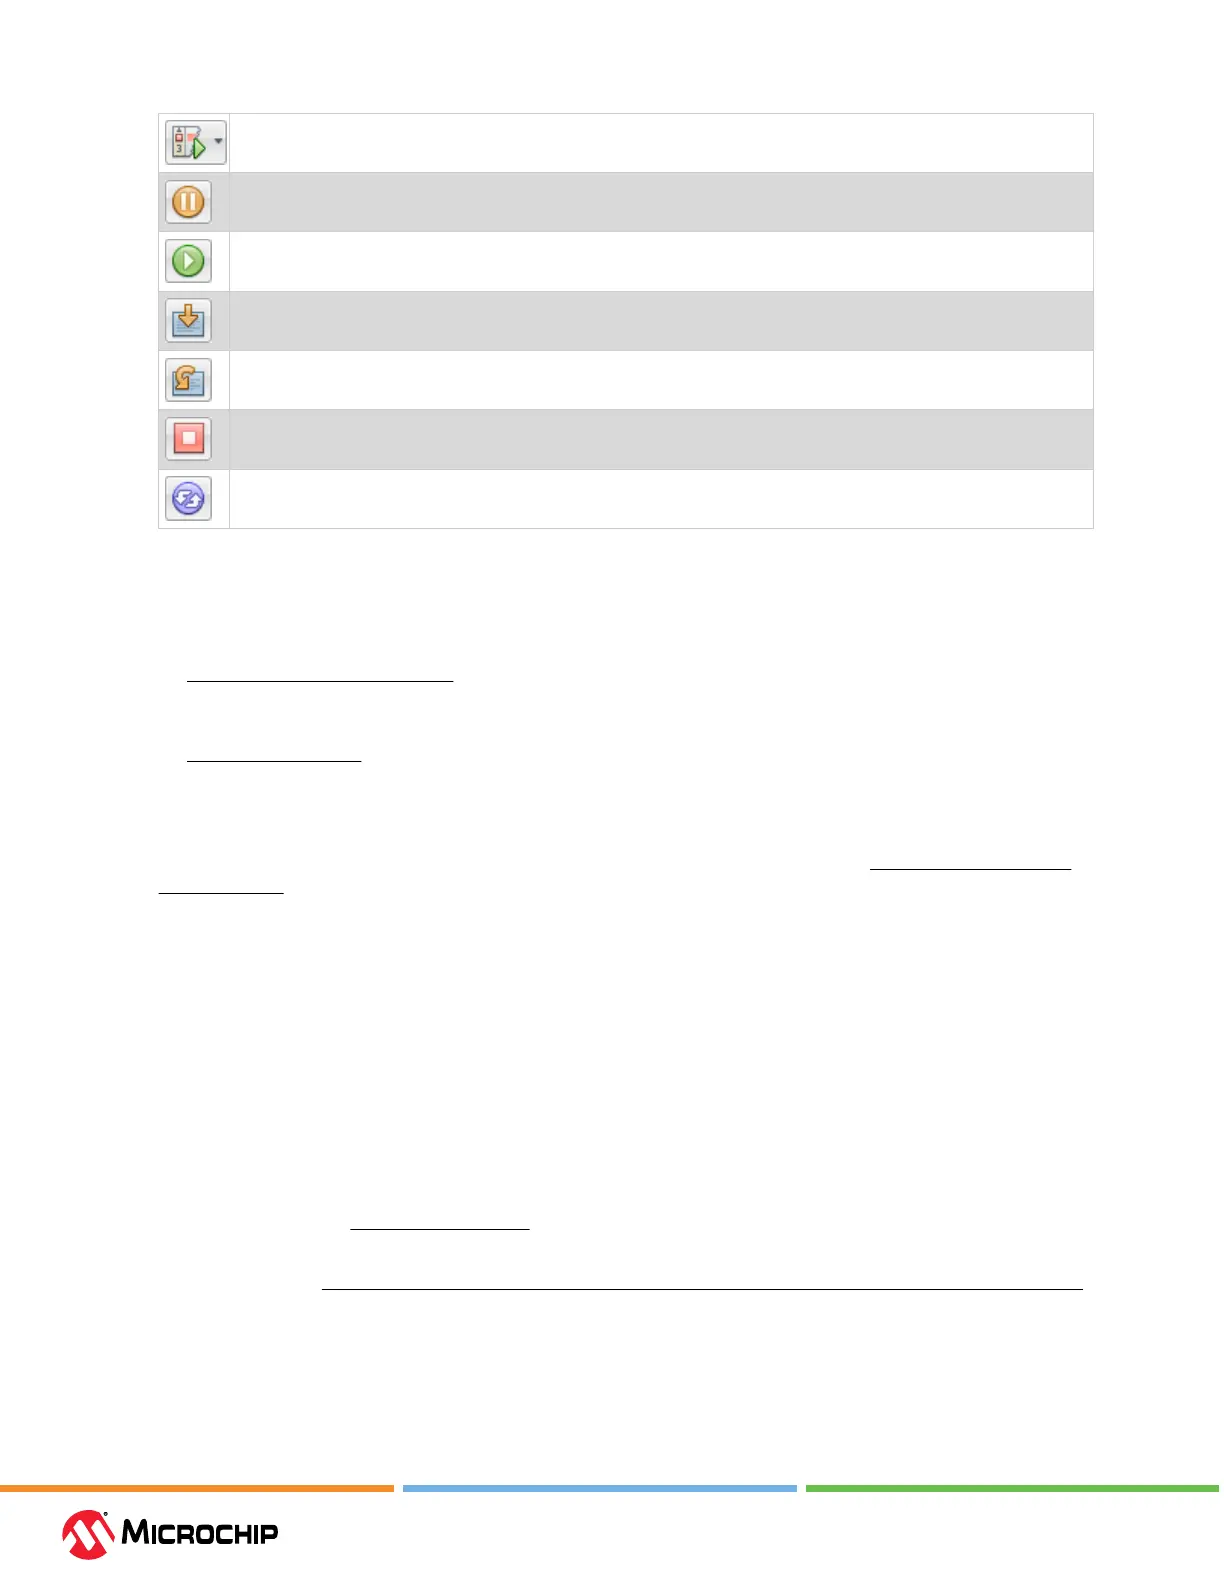
Debug or execute project code in debug mode.
Pause or halt code execution.
Continue code execution after a pause or halt.
For paused/halted code, Step Into or execute one instruction. Be careful not to step into a Sleep instruction or you
will have to perform a processor Reset to resume emulation.
For paused/halted code, Step Over an instruction.
Finish the debug session, which ends code execution.
Perform a processor Reset. Additional Resets, such as POR/BOR, MCLR and System, may be available, depending
on device.
4.4.1.2 View Processor Memory and Files
MPLAB X IDE provides several windows for viewing debug and various processor memory
information. These are selectable from the Window menu. See MPLAB X IDE online help for
assistance on using these windows.
• Window>Target Memory Views – view the dierent types of device memory. Depending on the
selected device, memory types include Program Memory, File Registers, Conguration Memory,
etc.
•
Window>Debugging – view debug information. Select from variables, watches, call stack,
breakpoints, stopwatch, and trace.
To view your source code, nd the source-code le you wish to view in the Projects window and
double click it to open it in a Files window. Code in this window is color-coded according to the
processor and build tool selected. To change the style of color-coding, select Tools>Options>Fonts &
Colors>Syntax.
For more on the Editor, see MPLAB X IDE online help, Editor section.
4.4.1.3 Use Breakpoints
Use breakpoints to halt code execution at specied lines in your code.
4.4.1.3.1 Breakpoint Resources
For 16-bit PIC/dsPIC devices, breakpoints, data captures, and runtime watches use the same
resources. So, the available number of breakpoints is actually the available number of combined
breakpoints/triggers.
For 32-bit PIC devices, breakpoints use dierent resources than data captures and runtime watches.
So, the available number of breakpoints is independent of the available number of triggers.
The number of hardware and software breakpoints available and/or used is displayed in the
Dashboard window (Window>Dashboard). See the MPLAB X IDE documentation for more on this
feature. Not all devices have software breakpoints.
See MPLAB X IDE Help>Help Contents>Hardware Tool Reference> Limitations - Emulators and Debuggers
for limitations on breakpoint operation, including the general number of hardware breakpoints per
device and hardware breakpoint skidding amounts.
4.4.1.3.2 Hardware or Soware Breakpoint Selecon
To select hardware or software breakpoints: