Web Interface
Please Note: It takes a few moments for the charting applet to open in a separate browser
window on the host computer. After the charting applet is open, you have access to several
options to customize the graph to your liking.
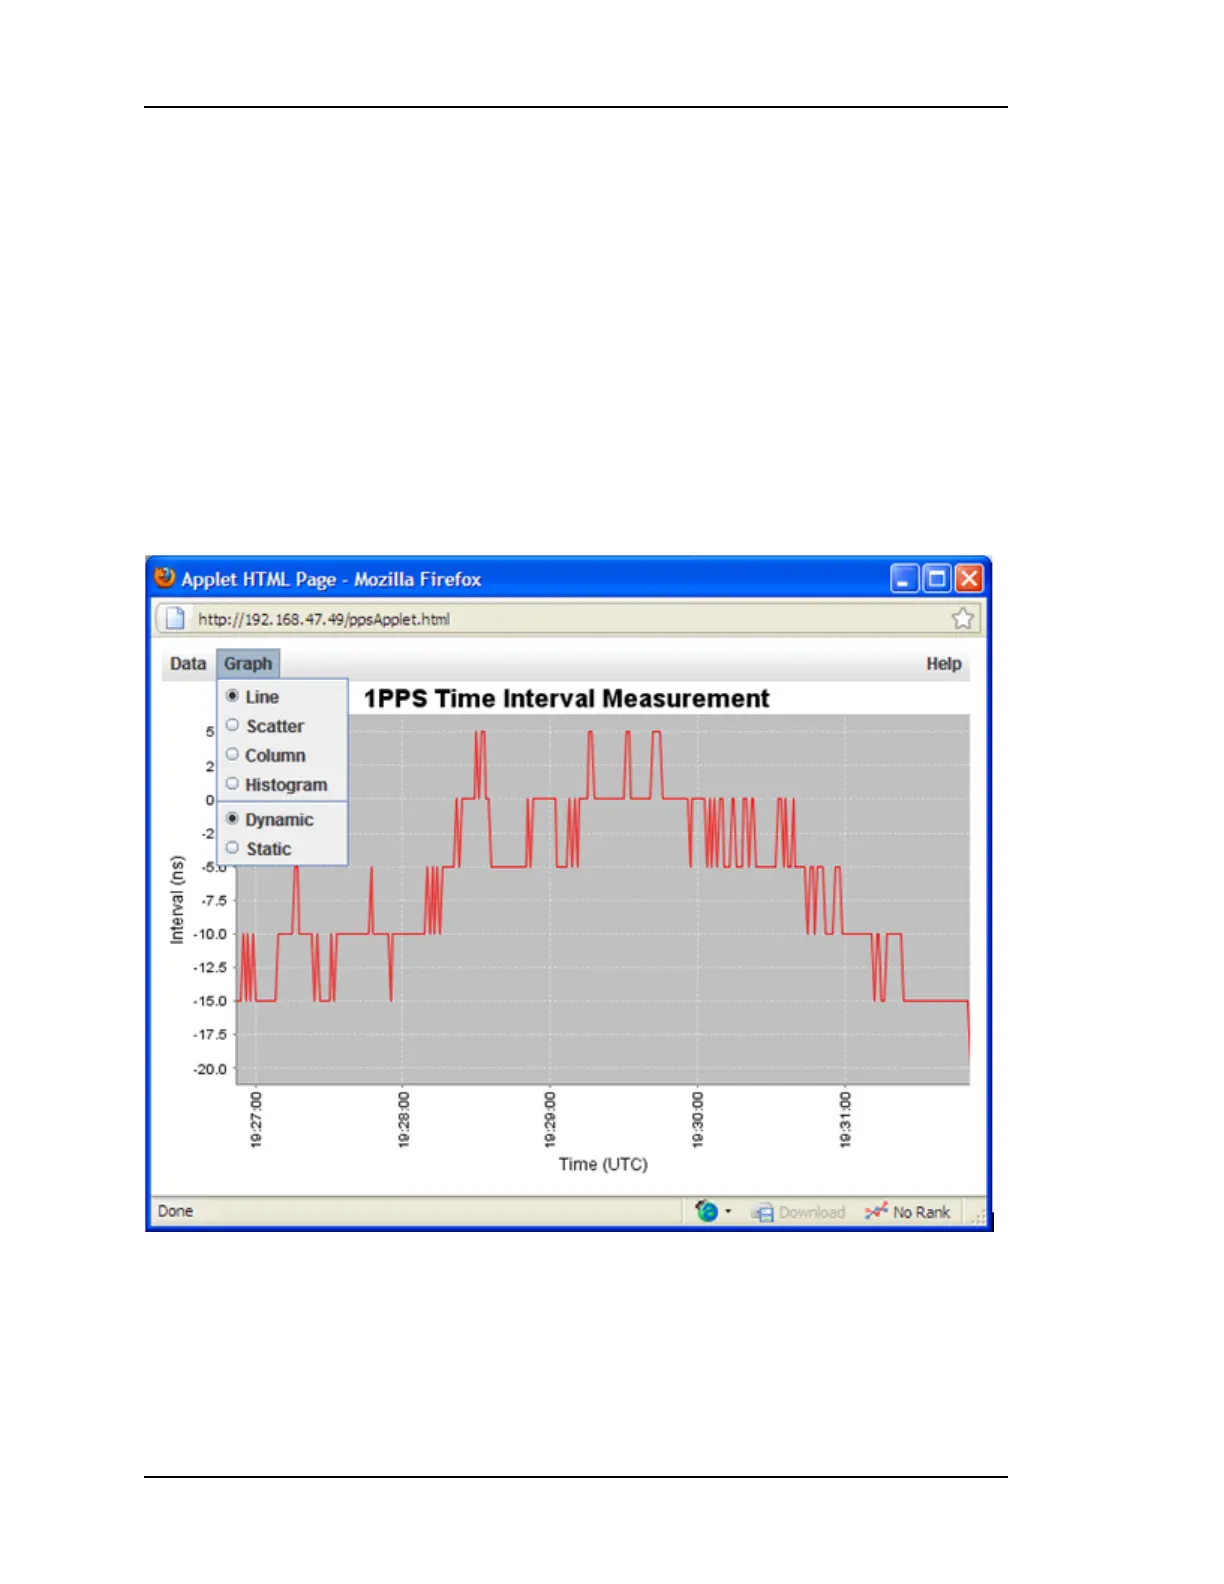
Pressing the Graph pull down menu in the upper left of the applet allows you to select
among the following chart types to view the Time Interval Measurement data:
l Line
l Scatter
l Column
l Histogram
From the Graph pull down menu, you can also select between a Dynamic or Static view of
your data. If you are currently running a measurement and would like to view the data as it is
being processed, select the Dynamic view.
From the Data pull down menu, you can view data from the:
l Last 5 minutes
l Last 15 Minutes
l Last Hour
l All Data
l Custom Data Range…
Page 68..........................................................................997-01520-02 Rev. F1