6 - 40 Operator’s Manual
6 Image Acquisition
6.14.3 Select Image and Cardiac Cycle
You can select images with a better image quality so as to guarantee the analysis result.
Switch the cine file
1. Tap [Review] to enter the review state on touch screen.
2. Double-click the target file.
3. The system closes current displayed file and switch to the newly selected file.
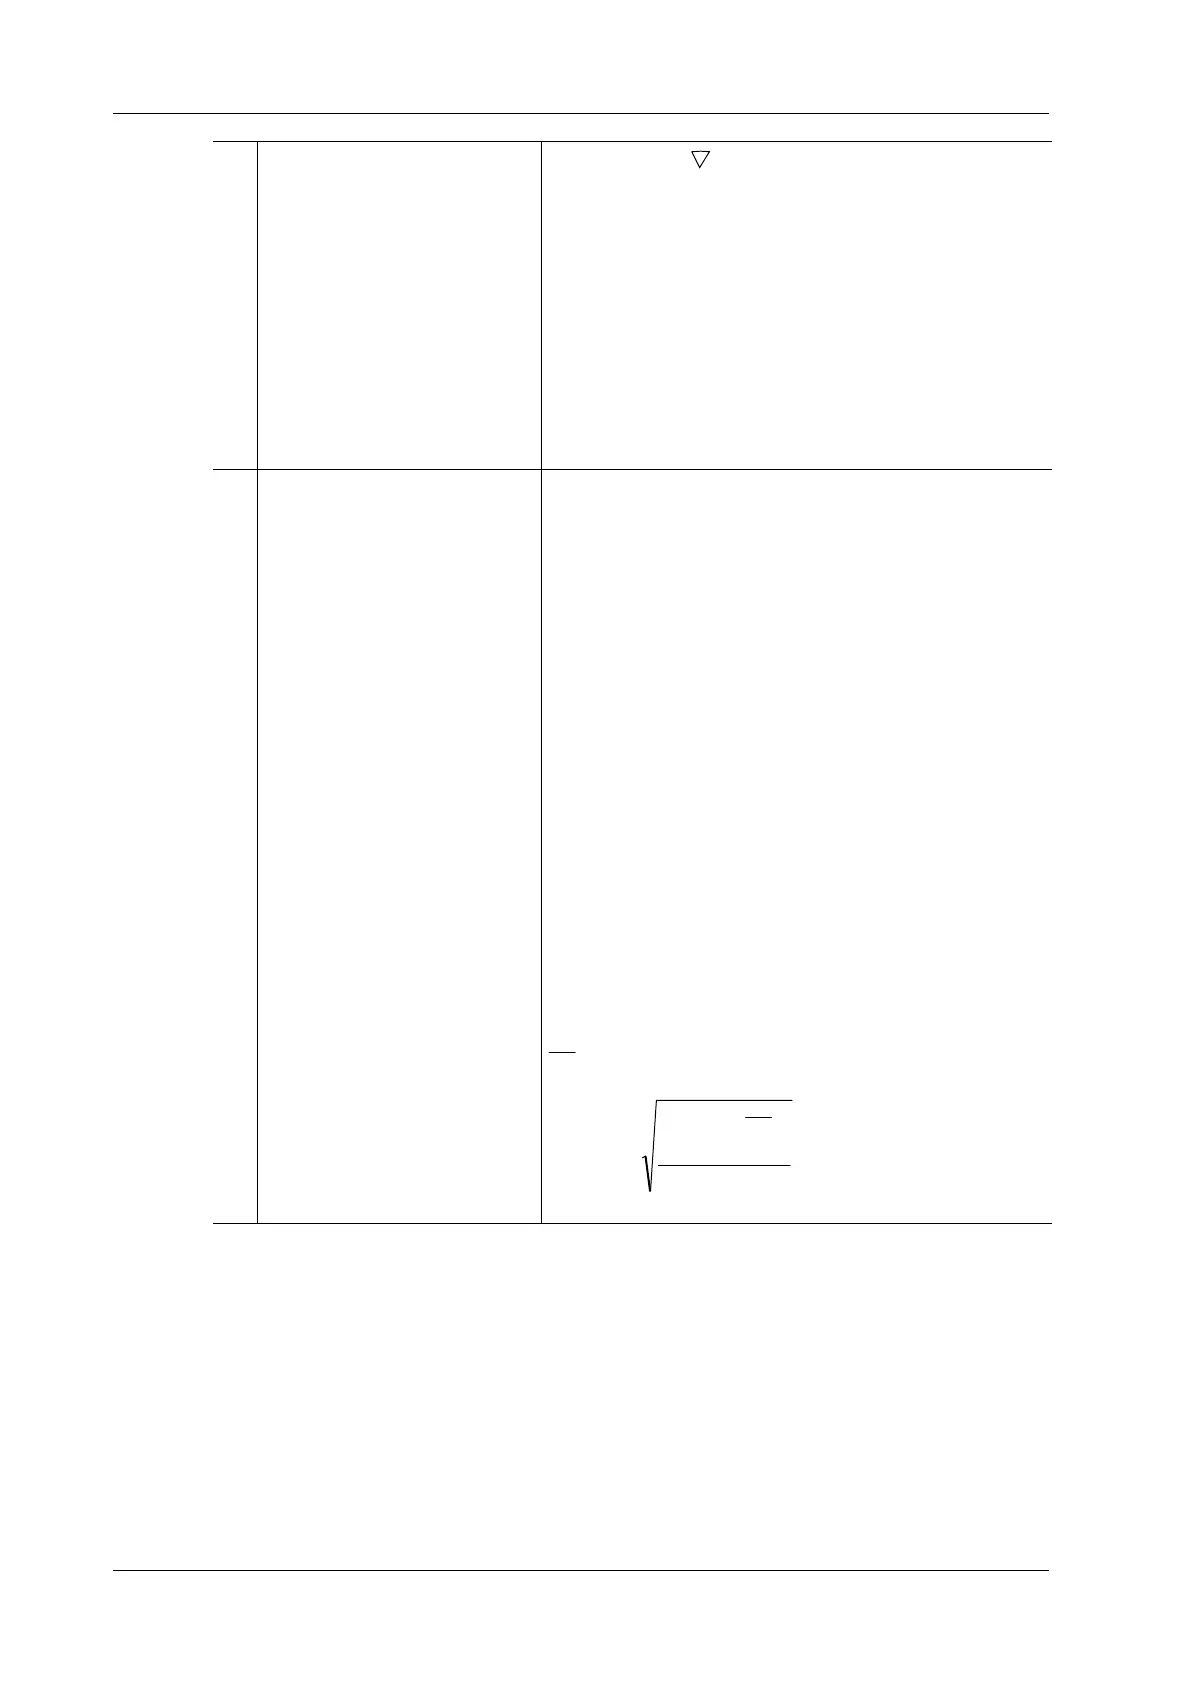
5 Displays cardiac segmentation
model, and each segment name
is illustrated beneath the model.
• In the figure, marks the peak position of the curve.
• Under tracking status, click on a segment in the cardiac
segmentation model. The segment has “X” mark and its
corresponding calculating is eliminated.
• Tap certain segment in the cardiac segmentation model,
the segment will turns grey and its corresponding curve
no longer displays.
• You can get the current X/Y axis value by moving the
cursor onto one point on the curve; and if you press
<Set> at this time, the frame marker will move to the
spot.
The segment boundary color indicates the tracking quality.
6 Displays measurement and
calculation results
• EDV: Maximum value of the end diastolic volume
during the trace.
• EDA: Maximum value of the end diastolic area (Left
Ventricular) during the trace.
• ESV: Maximum value of the end systolic volume (Left
Ventricular) during the trace.
• ESA: Maximum value of the end systolic area (Left
Ventricular) during the trace.
• FAC (for short axis section): Fractional Area Change=
(EDA — ESA)/EDA
• EF (for long axis section): Ejection fraction
•HR: Heart rate
• Global strain of all segments.
• Displays when strain rate curve is acquired.
• Global strain rate of all segments.
• Displays when strain rate curve rate is acquired.
Also on Bull’s Eye figure, the system displays TPSD value:
Time to Peak Standard Deviation (TPSD):
Where, standardized value of time to peak data:
. (N is the number of time to peak data)
Average value of standardized value of time to peak data:
, and the standard deviation is

 Loading...