OPI-PulseNGKit-en-141106
Version: 2.01
Page 17 of 31
021,725,1*62/87,216
Operating Manual
PulseNG Kit
Settings
1 Reset alarms Teach Settings Save limits Event Log Cong Login Statistics
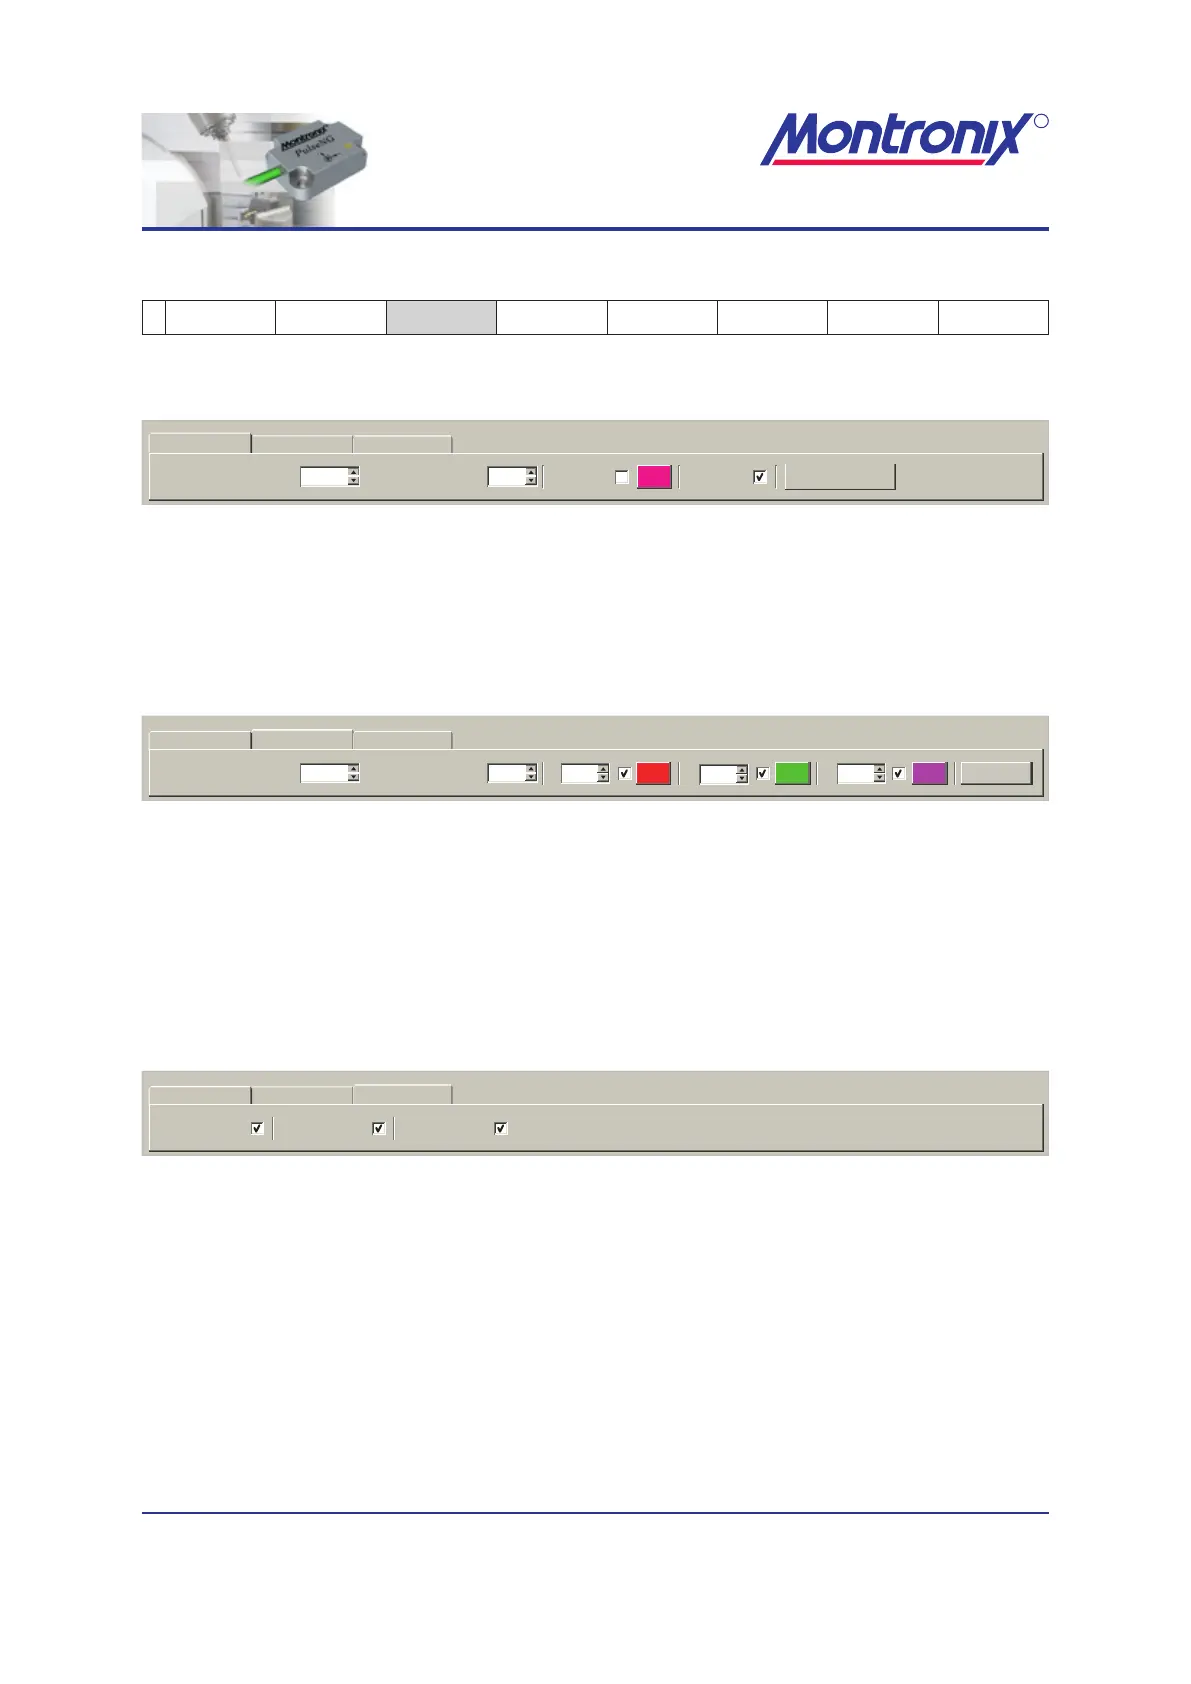
Filter data view
20 10Y-Axis Scaling [m/s²]: X-Axis Scaling [s]:
Filter data view Raw data view Statistics
Auto scaling
DSP view Filter view
Figure 6: Filter data view
Here you can change the scaling of the axes and hide / unhide the display of DSP,
and lters. Selecting “Auto scaling” will display the axes to t the window.
Raw data view
X: Z:Y:50-5
20 10
Adjust
Filter data view Raw data view Statistics
Y-Axis Scaling [m/s²]: X-Axis Scaling [s]:
Figure 7: Raw data view
Relates to the window with raw data at the bottom right. The horizontal display level of
the axes can be varied in height.
Checking the appropriate box can hide / unhide the display of X, Y, Z-axes. Selecting
„Adjust lines“ makes for an even distribution of the three curves above the Y-axis.
Statistics
Limit 1 view: Limit 3 view:Limit 2 view:
Filter data view Raw data view Statistics
Figure 8: Statistics
Relates to the statistics view. The display of individual limits can be hidden or shown
by (de-)activating the check boxes.