OPI-PulseNGKit-en-141106
Version: 2.01
Page 18 of 31
021,725,1*62/87,216
Operating Manual
PulseNG Kit
Save limits
1 Reset alarms Teach Settings Save limits Event Log Cong Login Statistics
Figure 9: Save limits
Limits can be changed using the arrow keys when activated by the password. Save
changes with „Save limits“.
Event Log
1 Reset alarms Teach Settings Save limits Event Log Cong Login Statistics
Calls up the soft key bar for the selection of event logs.
021,725,1*62/87,216
R
PulseNG-hmi
pulseNG
1 255
1
2
3
4
5
6
7
8
9
10
1
1
1
1
1
1
1
1
1
1
11.0 mm/s
1.0 mm/s
1.0 mm/s
1.1 mm/s
25.0 m/s²
0.9 m/s²
27.4 °C
0.7 °C
0.7 °C
0.7 °C
1.3 mm/s
1.4 mm/s
1.3 mm/s
25.9 mm/s
0.8 m/s²
0.0 m/s²
0.0 °C
0.0 °C
0.0 °C
0.0 °C
1
1
1
1
1
1
2
1
1
2014/03/17 19:42:13
2014/03/17 19:41:48
2014/03/17 19:41:12
2014/03/17 19:41:08
2014/03/18 09:07:33
2014/03/18 09:07:04
2014/03/18 09:06:51
2014/03/18 08:47:03
2014/03/18 08:45:38
2014/03/18 00:06:41
Text EL
Graphics EL
Text EL
full view
Export
csv file
Sensor
Event Log
Back
Monitoring: Teaching: Scenario #:
Type
Scenario #
Limit # Limit Max Time/date
Axis (X,Y, Z,M)
Alarm
Alarm
Alarm
Alarm
Alarm
Alarm
Alarm
Alarm
Alarm
Alarm
Velocity
Velocity
Velocity
Temperature
Velocity
Temperature
Temperature
Z-Axis
Temperature
X-Axis
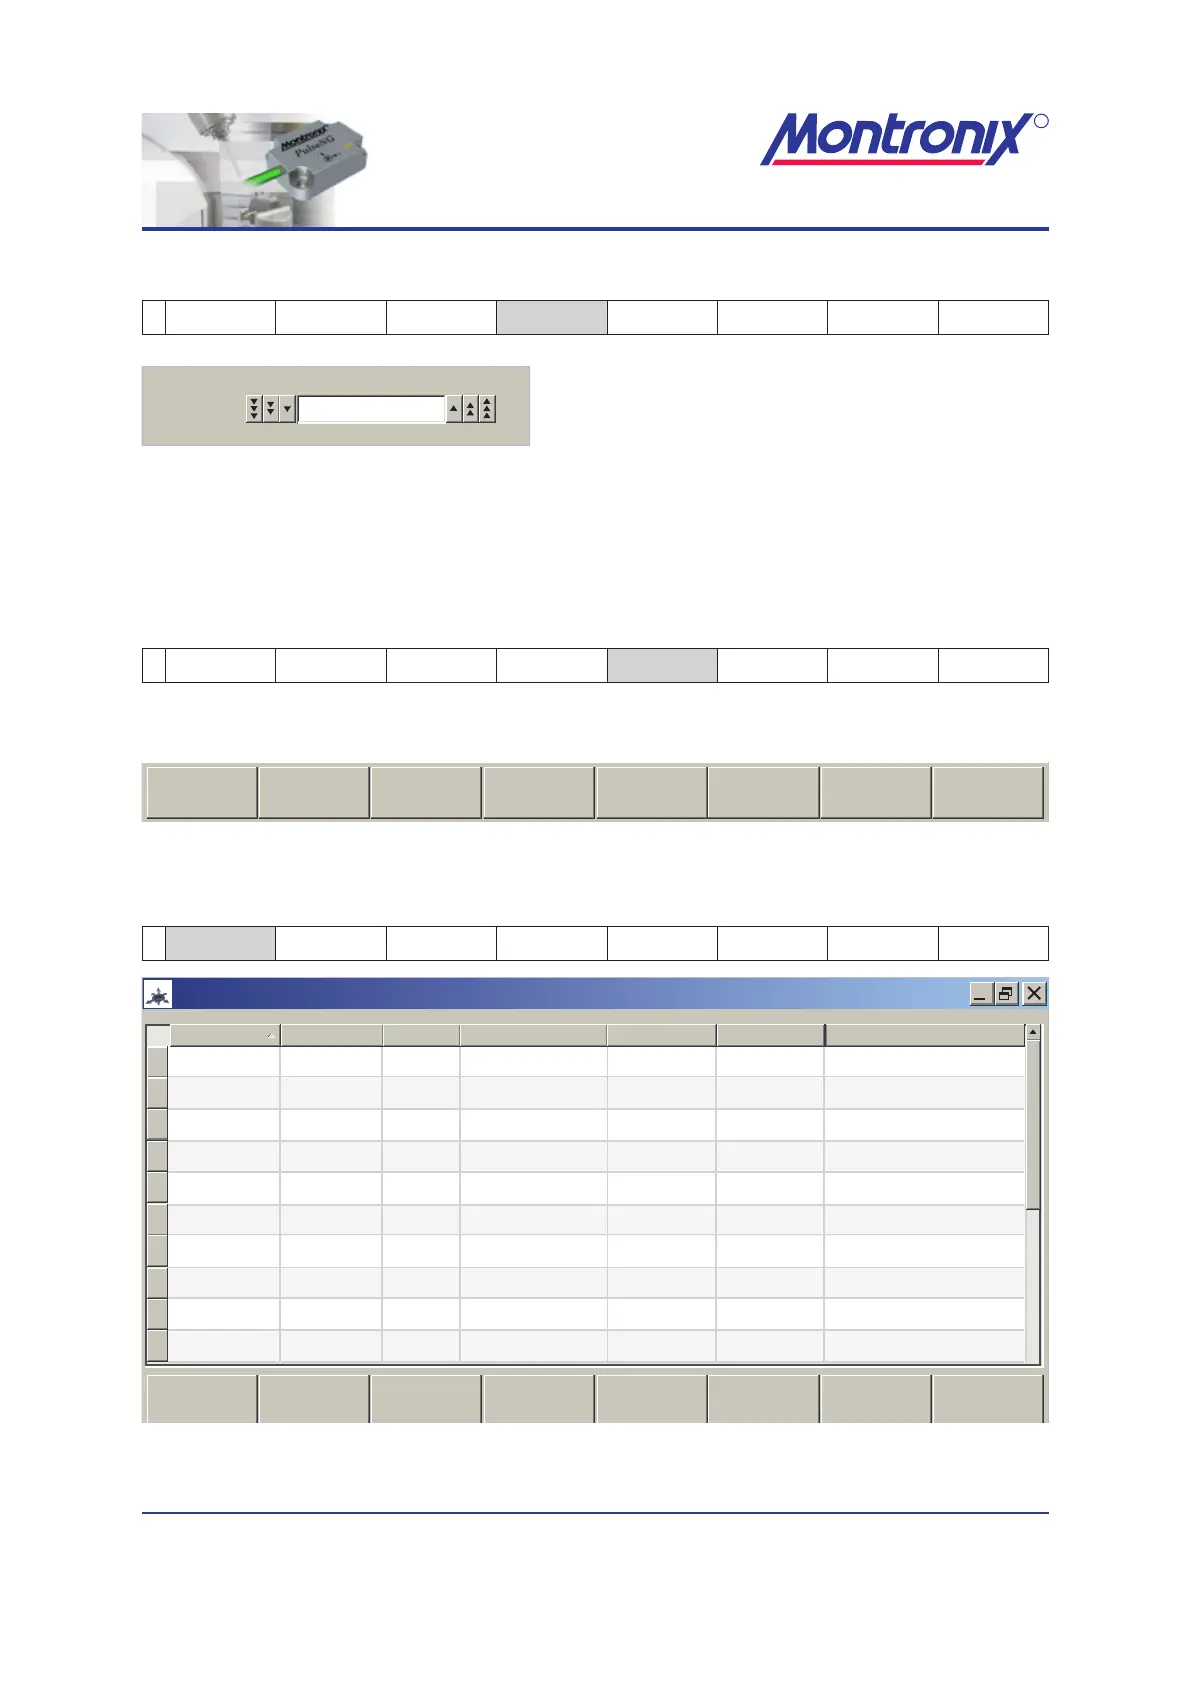
Figure 10: Soft keys for event logs
Text EL
2 Text EL Graphics EL
Text EL
full view
Export
csv le
Back
PulseNG-hmi
pulseNG
1
2
3
4
5
6
7
8
9
10
1
1
1
1
1
1
1
1
1
1
11.0 mm/s
1.0 mm/s
1.0 mm/s
1.1 mm/s
25.0 m/s²
0.9 m/s²
27.4 °C
0.7 °C
0.7 °C
0.7 °C
1.3 mm/s
1.4 mm/s
1.3 mm/s
25.9 mm/s
0.8 m/s²
0.0 m/s²
0.0 °C
0.0 °C
0.0 °C
0.0 °C
1
1
1
1
1
1
2
1
1
2014/03/17 19:42:13
2014/03/17 19:41:48
2014/03/17 19:41:12
2014/03/17 19:41:08
2014/03/18 09:07:33
2014/03/18 09:07:04
2014/03/18 09:06:51
2014/03/18 08:47:03
2014/03/18 08:45:38
2014/03/18 00:06:41
Text EL
Graphics EL
Text EL
full view
Export
csv file
Sensor
Event Log
Back
Monitoring: Teaching: Scenario #:
Type
Scenario #
Limit # Limit Max Time/date
Axis (X,Y, Z,M)
Alarm
Alarm
Alarm
Alarm
Alarm
Alarm
Alarm
Alarm
Alarm
Alarm
Velocity
Velocity
Velocity
Temperature
Velocity
Temperature
Temperature
Z-Axis
Temperature
X-Axis
Figure 11: Tex t EL
Shows the last 50 entries.