52
Fasting Trend Arrows
Readings in the Logbook may also include a trend arrow icon to give
you a general idea of your fasting glucose trend. The trend arrow
illustrates the direction of your average fasting glucose reading from
the past 3 days as compared to the median fasting value over the
7 days before the 3-day average. If your 3 day average is less than
6.9 mmol/L, then the arrows will show either an upward or downward
trend if there is greater than 1.4 mmol/L di erence between the 3 day
average and the 7 day median. If your 3 day average is greater than
6.9 mmol/L, then the arrows will show either an upward or downward
trend if the di erence between the 3 day average and the 7 day
median is greater than 20% of the 3 day average.
Note: For information on ~A1c trend arrows, please see section 11.3.
The Fasting Trend Arrow information should not be used to
assess the fasting glucose trend in pregnant women.
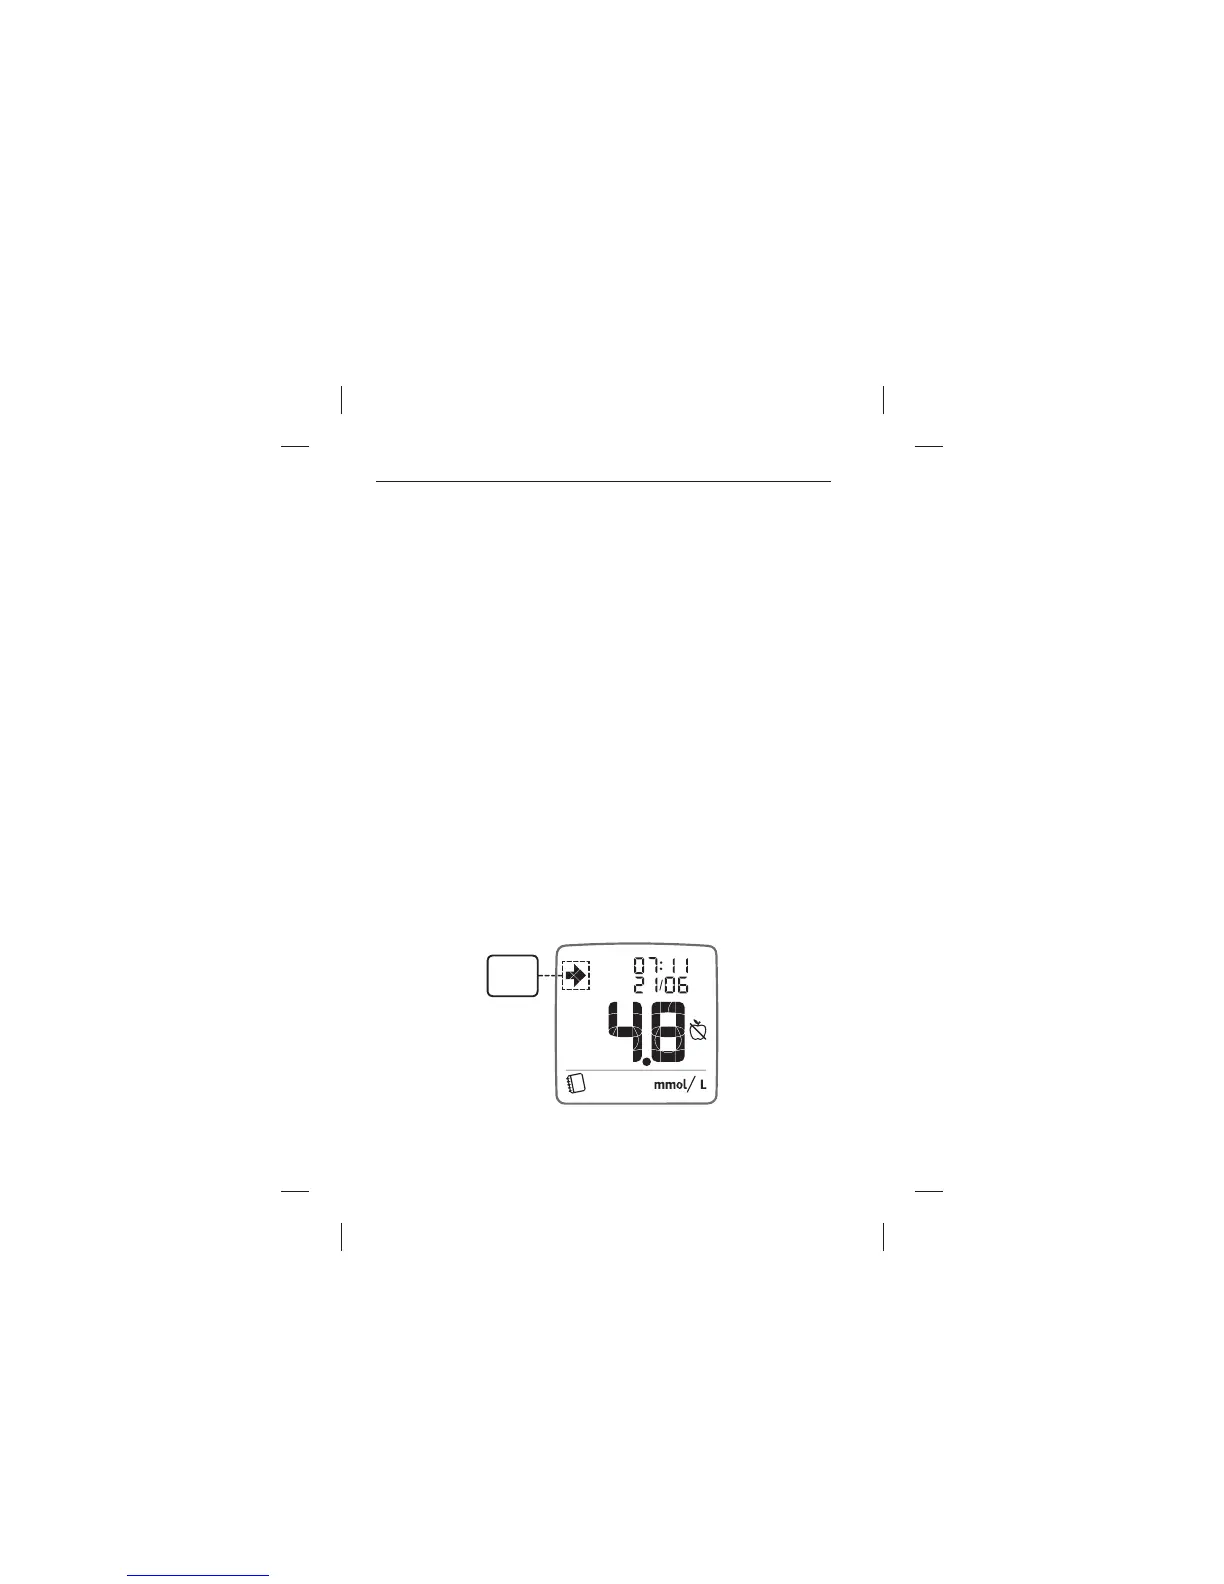
Steady Arrow: a steady arrow will appear above your readings if
your current 3-day fasting glucose average is similar to your 7 day
fasting glucose median from 3 days ago.
Data Management Features: Logbook
Steady
Arrow