55
Data Management Features: Averages
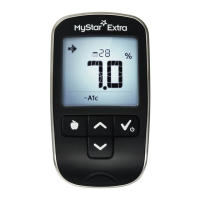
Averages11. 2
The MyStar Extra® categorizes readings based on the selected
mealtime tag and displays the corresponding average at 3, 7 and
30 days. These averages allow you to see how your blood glucose
levels vary by time of day and over the course of several days.
Averages are categorized as the following:
• All (no mealtime tag icon): includes all
readings (tagged and untagged) for the
speci ed number of days.
• Fasting: includes all tagged fasting readings
for the speci ed number of days.
• Pre-meal: includes all tagged Pre-meal
readings for the speci ed number of days.
• Post-meal: includes all tagged Post-meal
readings for the speci ed number of days.
Symbols:
No Tag
Fasting
Pre Meal
Post Meal
All readings
(no symbol)