13-12 APD Mode Operating Instructions
13.4.2 Report (APD)
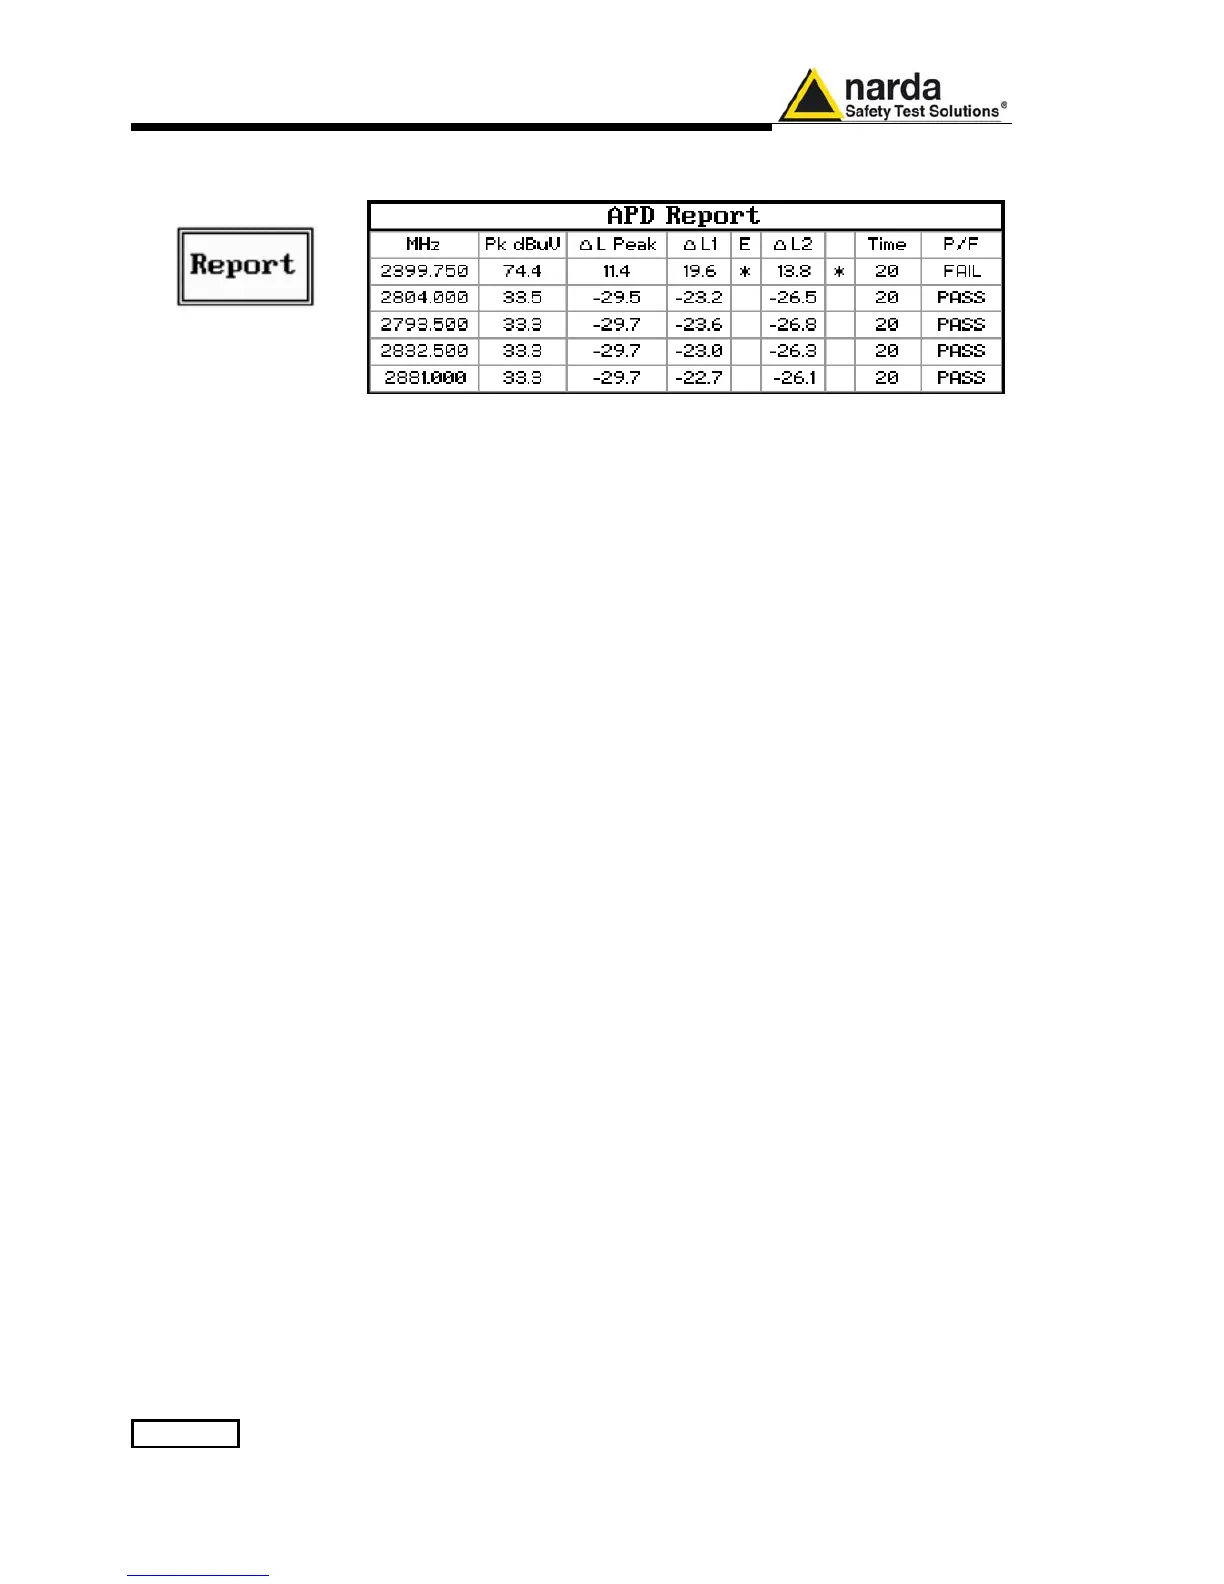
Press this button to show the last generated Report of measurements.
Press ESC button to go back to the Setup menu.
The report is represented as a table where the number of rows corresponds
to the number of frequencies entered in the Setup and nine columns detailed
below.
13.4.2.1 MHz
In the first column the frequencies (in MHz) are listed in order of level
strength from the highest to the lowest.
13.4.2.2 Pk dBµV
In the second column the measured Peak level for each frequency is shown.
This is the result of the Peak detector with the Max Hold time set in the Time
field of the Setup.
13.4.2.3 ∆L Peak
The third column shows the difference (in dB) between the level measured
during the search and the limit for the level plus YY Offset entered in the
Setup, for each frequency.
13.4.2.4 ∆L1
The fourth column shows the difference (in dB) between the level measured
during the search and the APD limit L1 entered in the Setup, for each
frequency.
13.4.2.5 E
The fifth column shows a * if the limit L1 has been exceeded.
13.4.2.6 ∆L2
The sixth column shows the difference (in dB) between the level measured
during the search and the APD limit L2 entered in the Setup, for each
frequency.
13.4.2.7
The seventh column shows a * if the limit L2 has been exceeded as for the
fifth column.
13.4.2.8 Time
In the eighth column the time duration of the measurement is indicated for
each frequency.
Normally it is the duration set for the Time parameter of the Setup page,
unless the test is manually interrupted before its programmed end.
13.4.2.9 P/F
The ninth column shows the test result (PASS/FAIL) for each frequency.