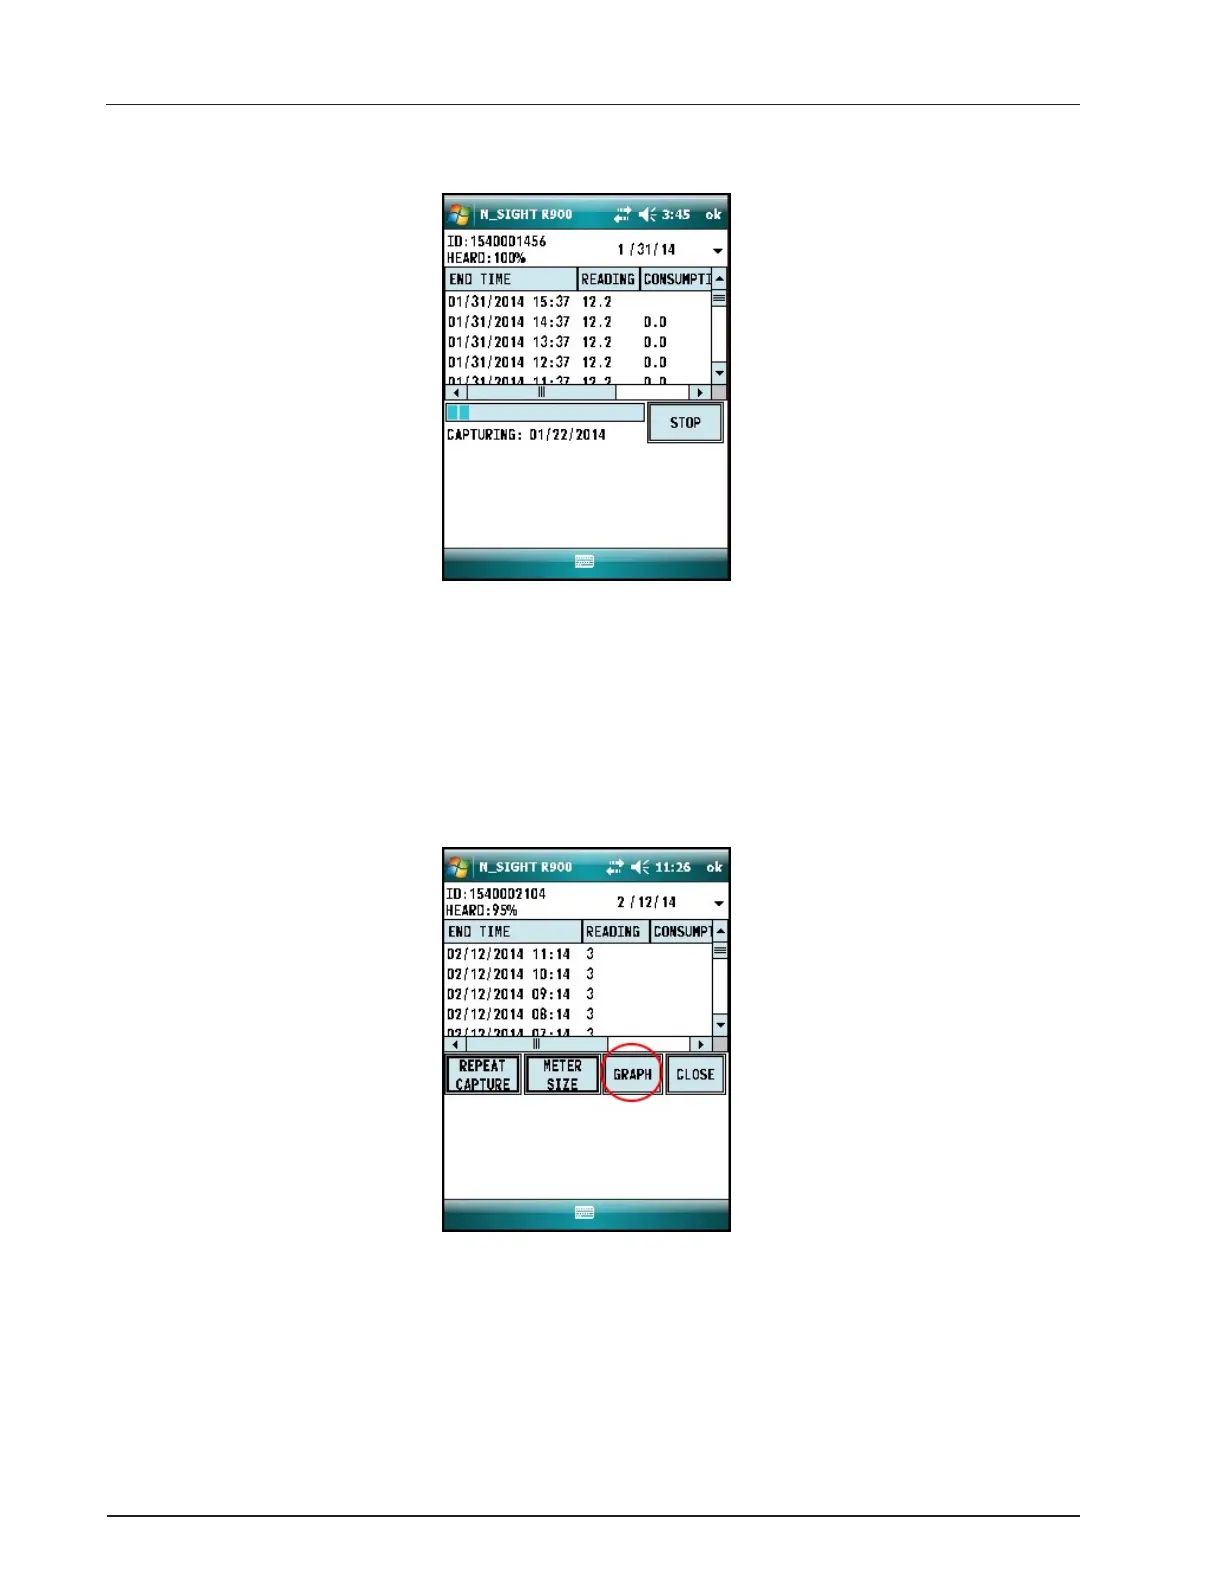
The screen displays the data received.
Figure 25 – E-CODER
®
)R900i™ Receives Data
2. Choose the meter size.
3. Click GRAPH to display the data in a graph. Examples of graphs are shown in Figure 27
on page 22
The HHU processes and saves the data. After closing the data logging screen, the unit
performs a backup.
Figure 26 – Graph Button
E-CODER
®
)R900
i
™ Installation and Maintenance Guide 21
Chapter 5: Data Logging Extraction