Sample Data Logging Graphs
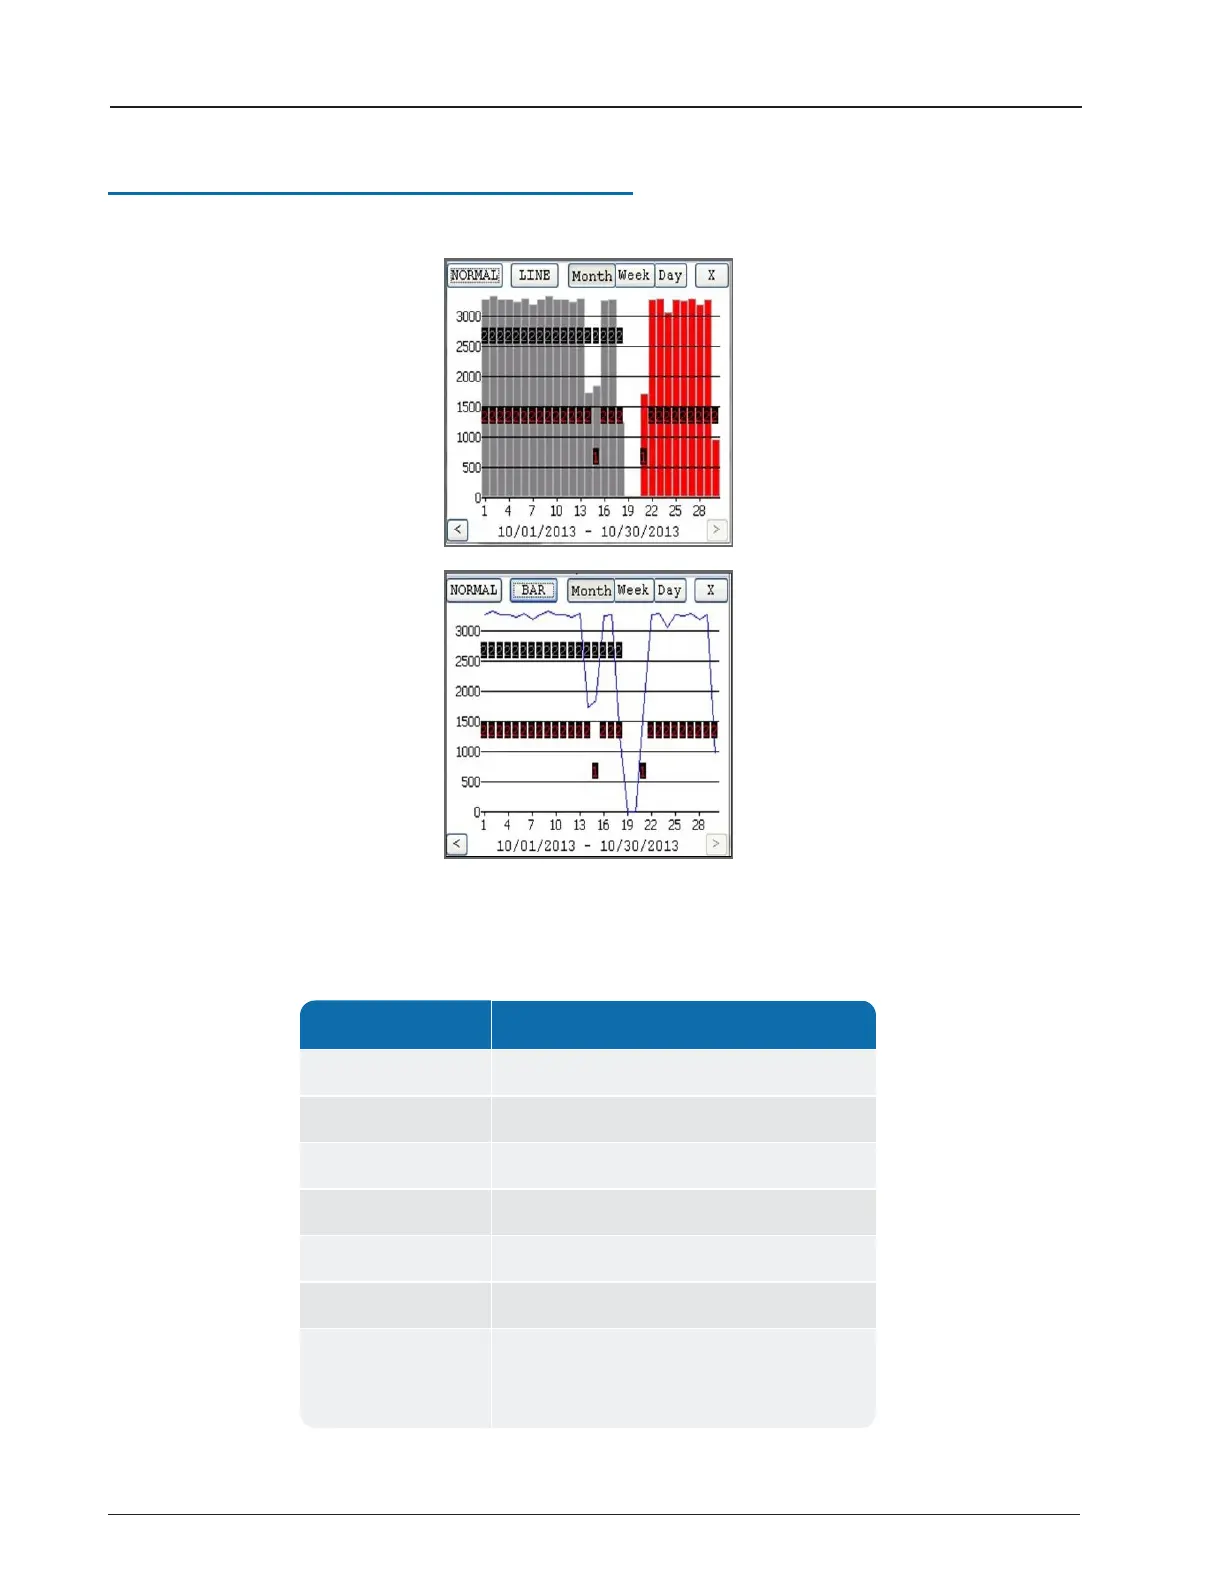
Following are two examples of the graphs that the data logging function produces.
Figure 27 – Example Data Logging Graphs
Color Code Description
1 Red Intermittent Leak
2 Red Continuous Leak
1 Gray Minor Backflow
2 Gray Major Backflow
Blue bars No Flags
Red bars Leak
Gray bars Backflow – if the Backflow flag and the Leak
flag appear at the same time, Backflow (gray
bars) has precedence over Leak.
Table 4 – Data Logging Graph Legend
22
E-CODER
®
)R900
i
™ Installation and Maintenance Guide
Chapter 5: Data Logging Extraction