65 50_Afficheur_Multigraphic_um_UK_27
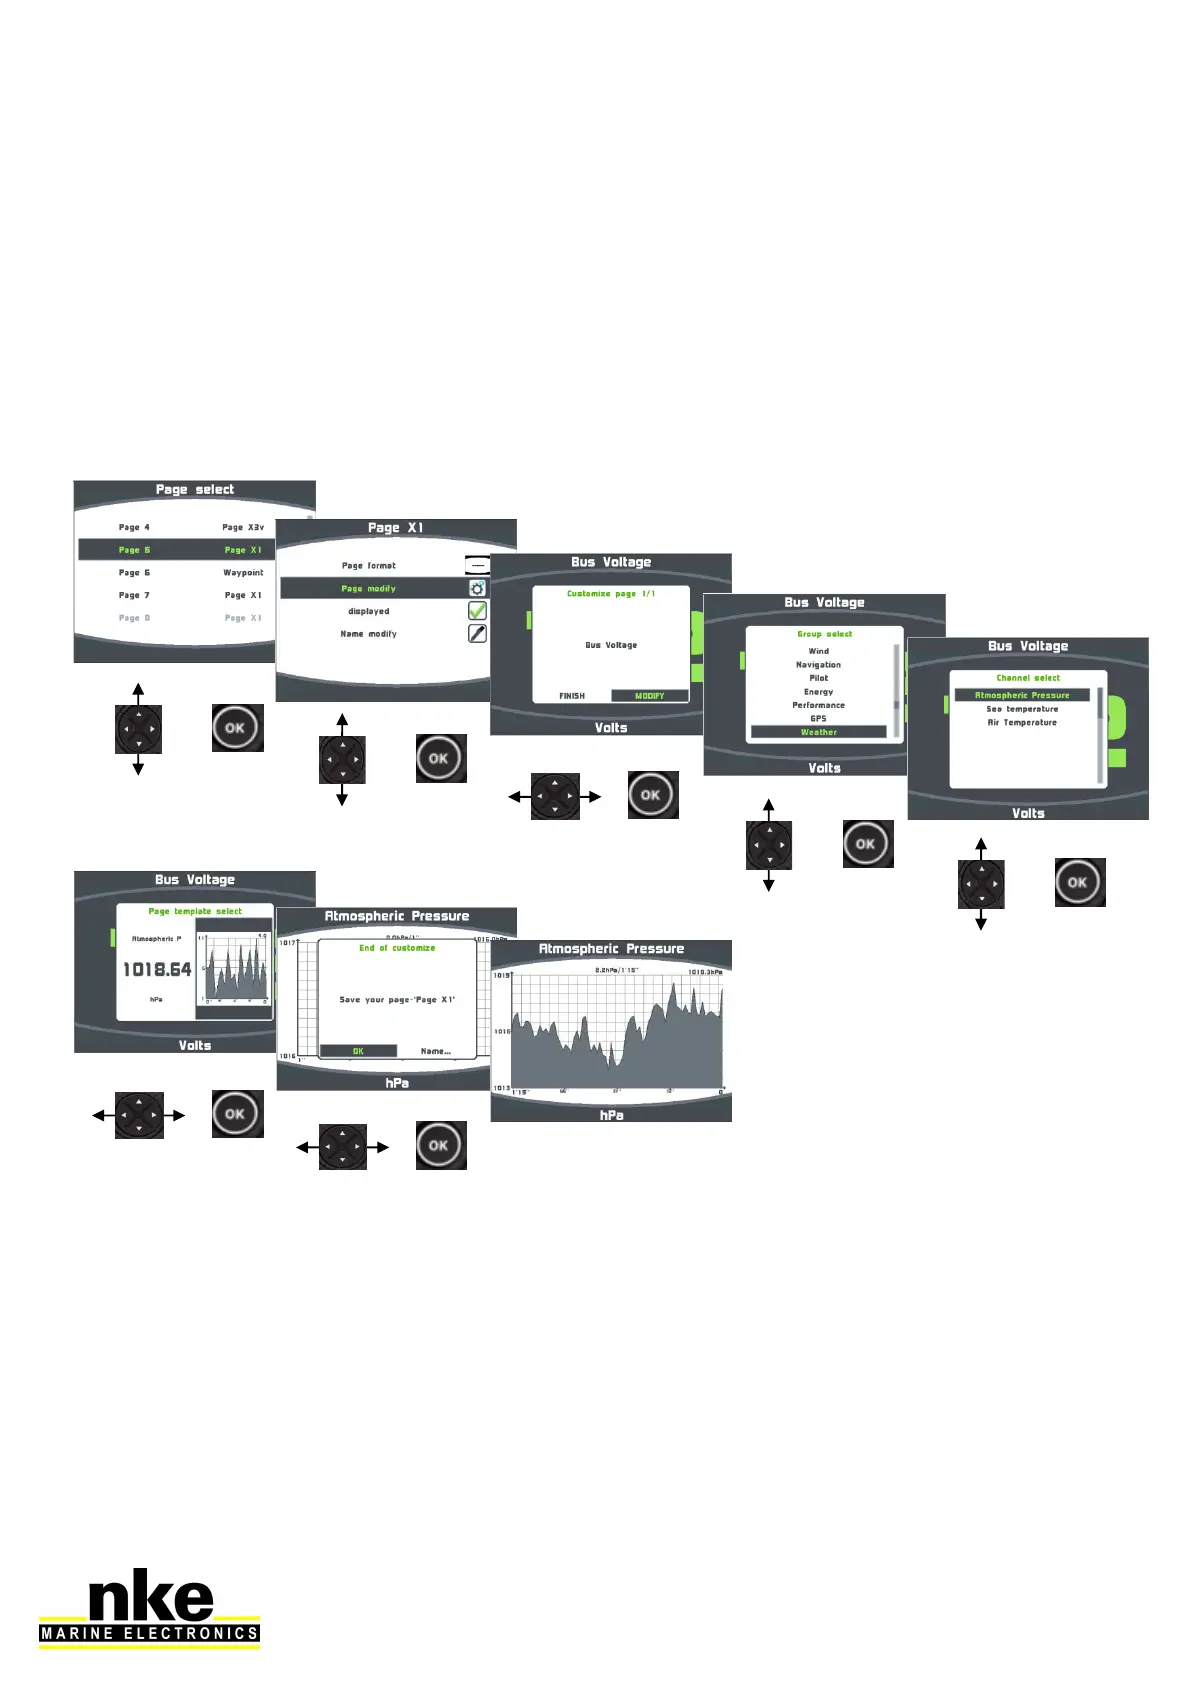
2.12 Graphs display
Some data coming from the Topline sensors can be displayed as a graph.
All data stored in the log can be displayed as a graph with a zoom function ranging
from 5 minutes to 48 hours depending on the time they have been logged.
Data which is not stored in the log can be displayed on a 5 minutes scale.
When you build or edit a page a graph widget is shown for the data which can be
displayed as a graph.