28
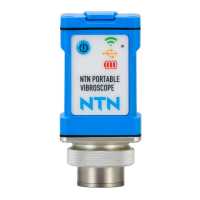
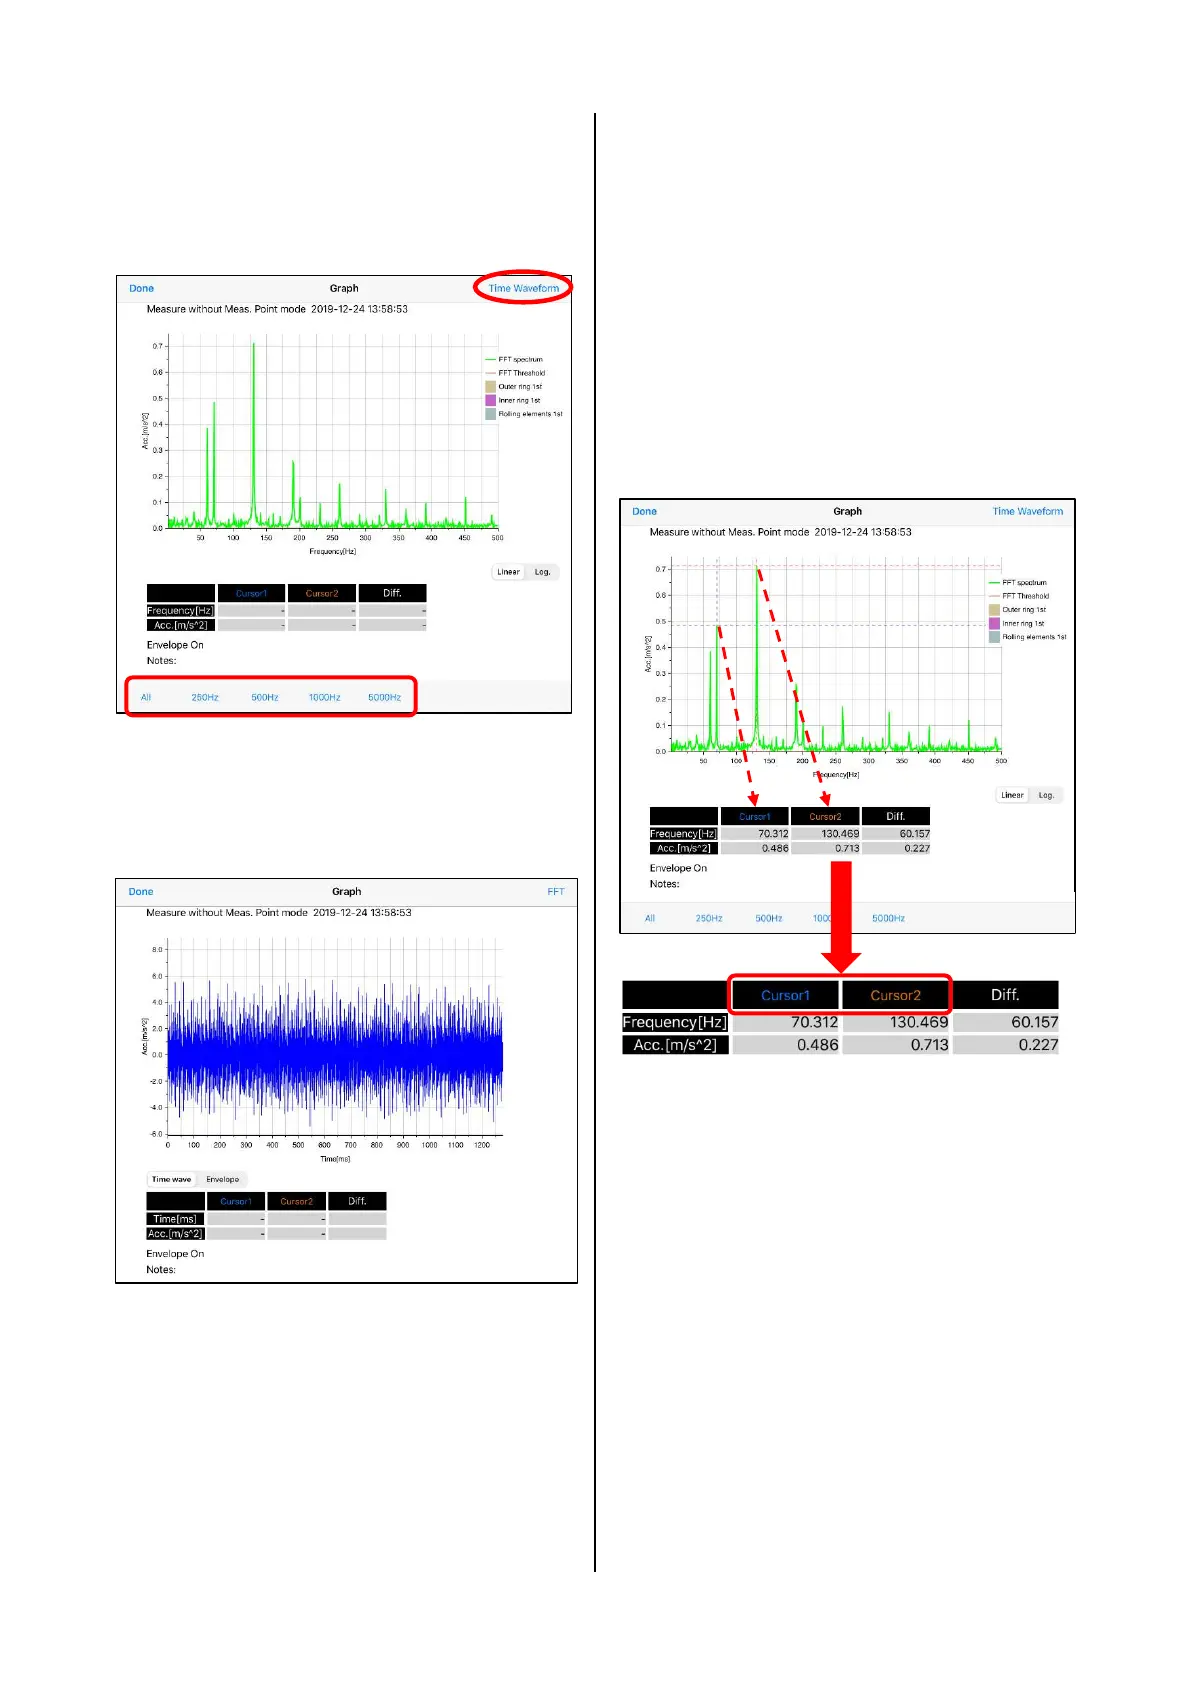
(5) When tapping "FFT" of the result screen of
Measure without Meas. Point, FFT spectrum is
displayed. When tapping the frequency button
at the bottom of the screen, the frequency
range of the graph can be specified.
Figure 4.25 FFT spectrum screen of
Measure without Meas. Point
(6) When tapping "Time Waveform" at the upper
right, the time waveform is displayed.
Figure 4.26 Time waveform screen of
Measure without Meas. Point
(7) Both of FFT spectrum and time waveform,
after tapping the cursor 1 or cursor 2 at the
bottom of the graph and swiping them on the
graph, the cross cursor moves. By releasing
the finger from the screen, the position is
established. The displayed cursor coordinates
are the coordinates of the cross intersection of
cursors 1 and 2, and the difference. The
waveform graph can be expanded or reduced
by pinch-out or pinch-in. Moreover, a
horizontal axis can be scrolled with horizontal
swipe.
Figure 4.27 Cursor coordinates