35
4.8 Changing method of vertical axis maximum value of graph
The maximum value of the vertical axis on the graph displayed on the tablet can be changed.
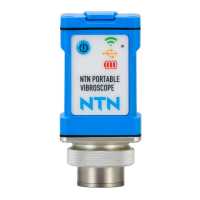
(1) When tapping the scale of vertical axis on the graph, the screen where Ymax can be input appears.
Figure 4.49 Graph before change
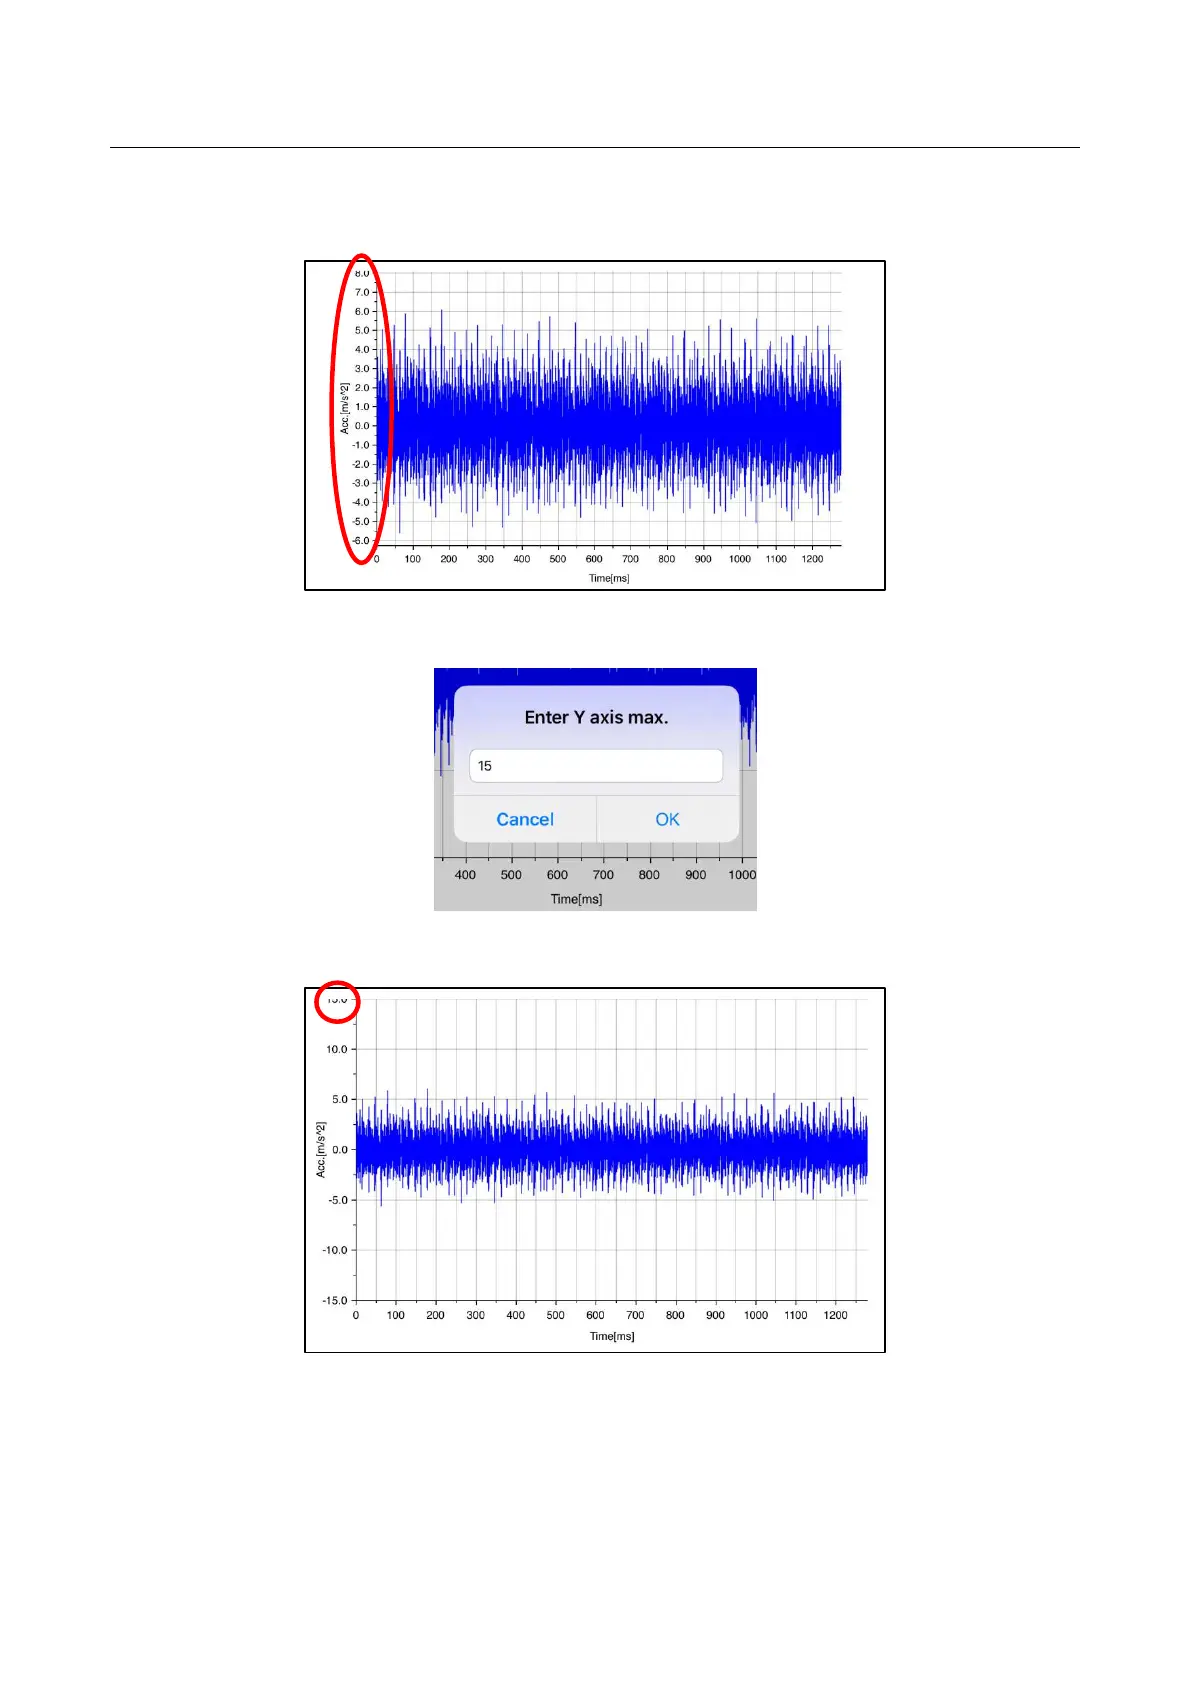
Figure 4.50 Ymax input screen
Figure 4.51 Graph after change
(2) Besides the time waveform graph, a similar change is possible even for the FFT graph and the trend
graph.