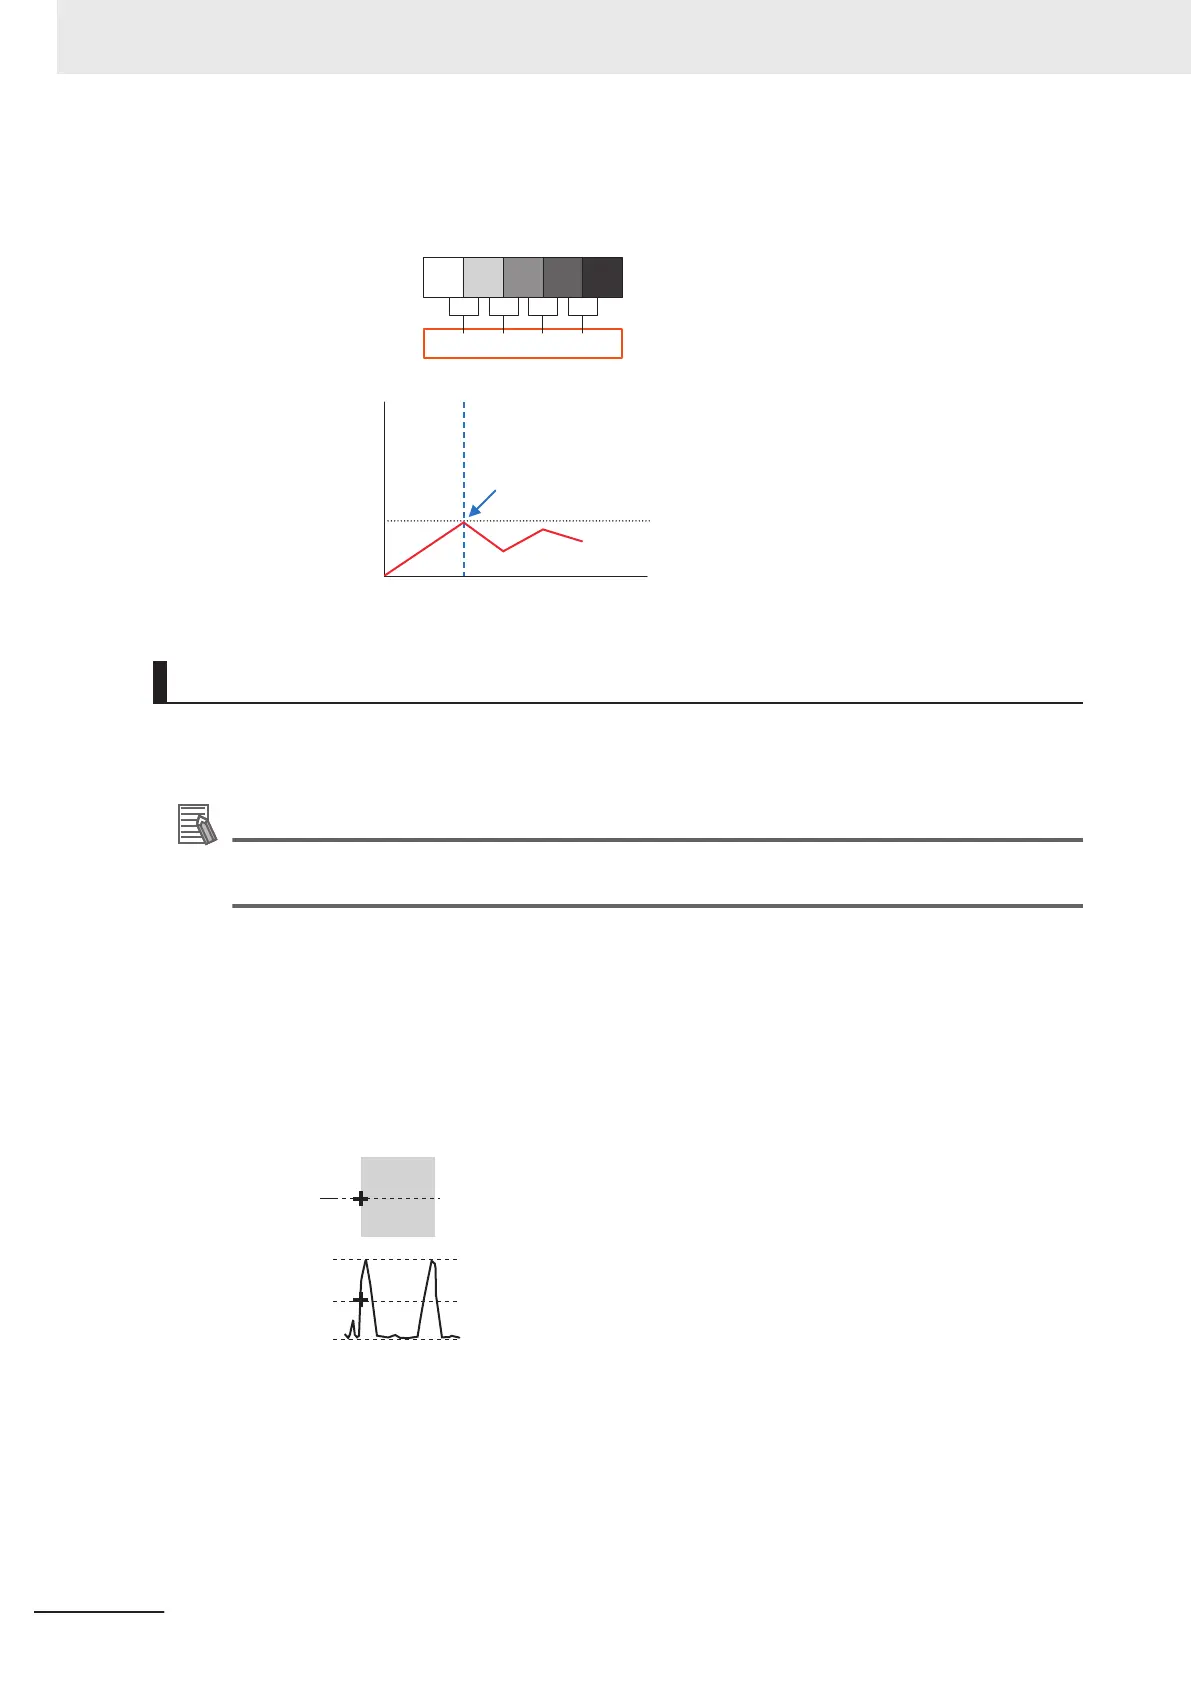
With an image with low contrast, the differential method is suitable as it normalizes the differences
between the neighboring pixels for processing.
0
255
200
150
100
50
Differential value
(Change in density)
Density average
85 37 63 50
255 170 133 70 20
Change in density
Edge level
Detection as an edge
Edge Level
Indicates the edge color change level (degree of color difference). This level is adjusted if edges can-
not be accurately detected.
Additional Information
The value 0 to 100 for the edge level indicates the edge intensity. It is not related to color differ-
ence in the original images.
• For case of measurement using relative position (%) with regards to width of color difference:
The edges are detected in the following manner.
(1) Calculate the overall distribution of color difference in the measurement region.
(2) Min. color difference value: 0%; Max. color difference value: 100%
(3) Locations in which there is an edge level color difference are detected as edges.
• • Edge Position:
Measurement
region
100%
50%
0%
Max. color difference
Edge level
Min. color difference
The position where the area of the part surrounded by the Min. color difference(lower limit value)
and the Max. color difference(upper limit value) is divided equally is taken as the edge level.
• Edge Pitch:
Appendices
A - 16
FH/FHV Series Vision System User’s Manual (Z365-E1)
 Loading...