Contents of the numeral
memory table referenced
to find the 100% value
changed part way through
graph display
0%
100%
395
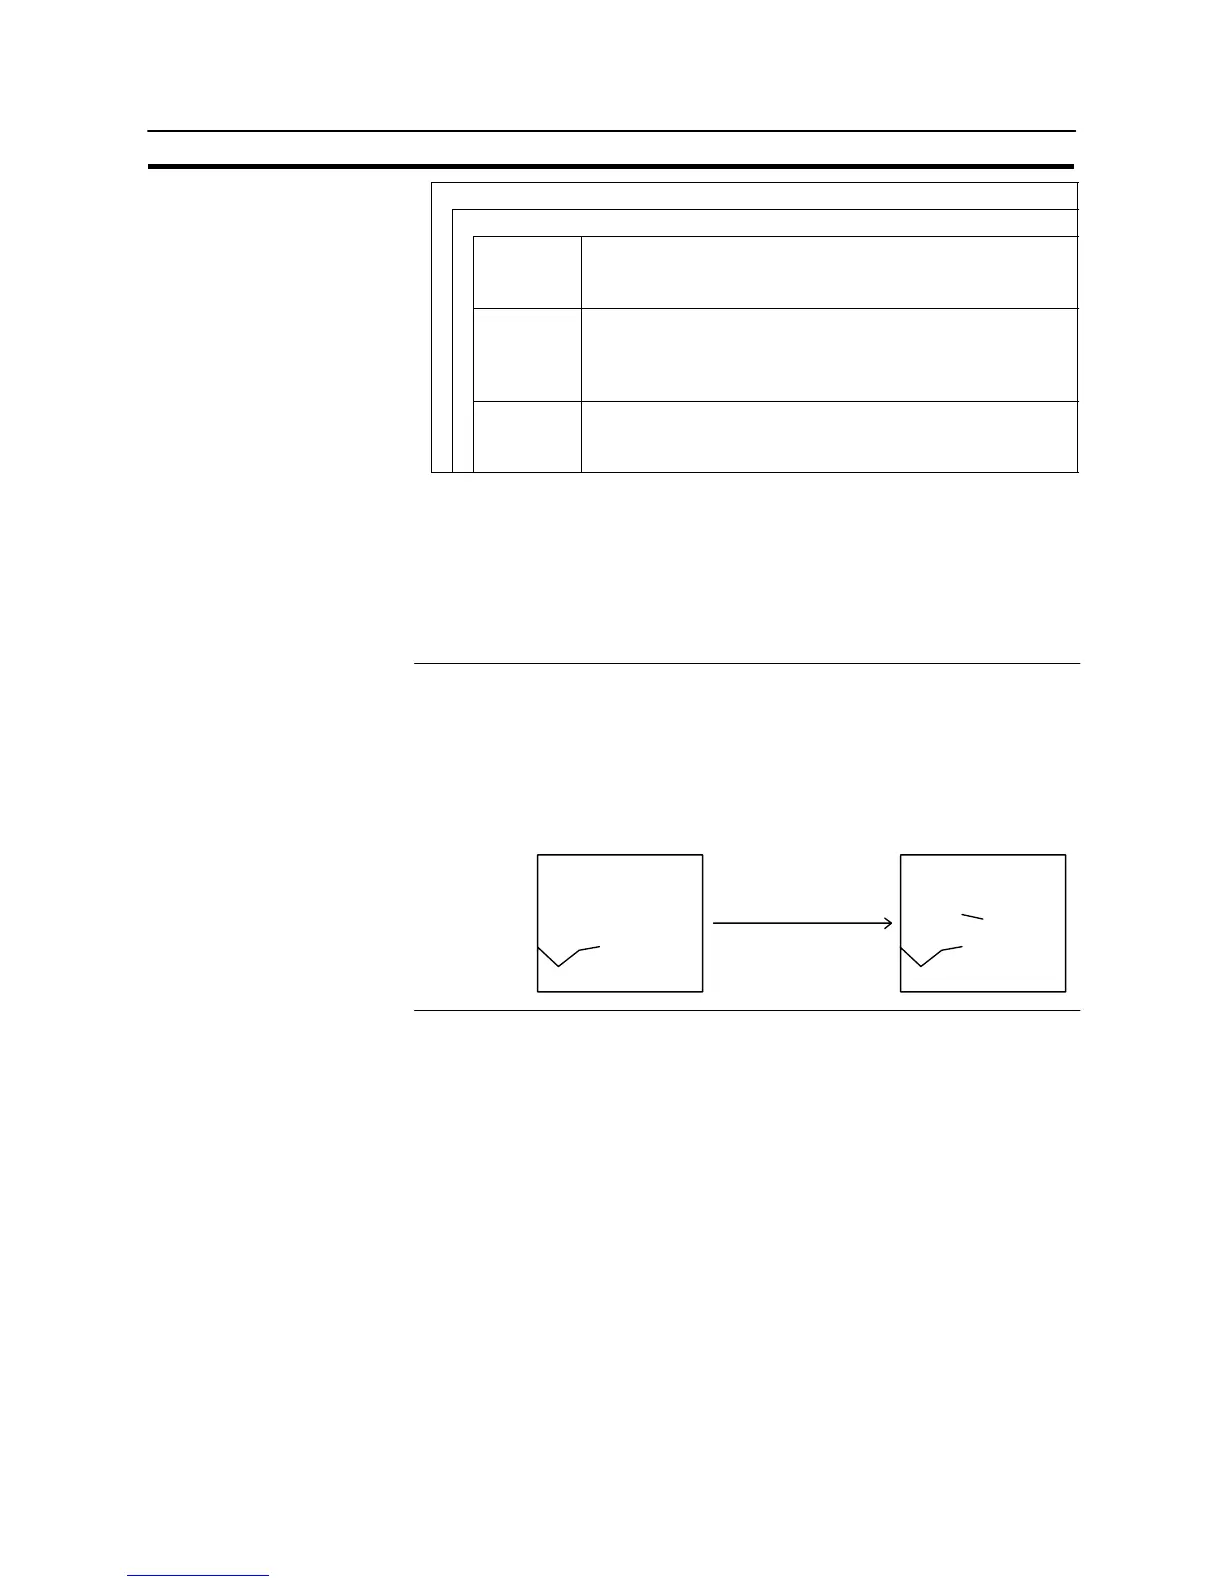
Graphs
Section 7-10
Logging
Touch Switches for Display Function
Stop Presence/absence of a touch switch to stop data sampling
Check mark (touch switch set)/
No check mark (touch switch not set)
Clear
Display
Presence/absence of a touch switch to clear the trend graph
display
Check mark (touch switch set)/
No check mark (touch switch not set)
Continue Presence/absence of a touch switch to restart data sampling
Check mark (touch switch set)/
No check mark (touch switch not set)
*1 The −100% value, 0% value, and 100% value must comply with the following
relationship:
−100% value < 0% value < 100% value
Either “Table Entry” or “Value” should be set for each value, not both. The choice
of “Table Entry” or “Value” setting can be made independently for each value.
*2 These settings are effective only when the logging function is used.
The line thickness for trend graphs is fixed as 1 dot.
Reference - If a small value is set for “Interval Type”, even if “broken line”, “1-dot chain line”,
or “2-dot chain line” is specified the line will appear to be a solid line.
- In the case of a standard trend graph which determines the “100%”, “0%” and
“−100%” values according to the “Table Entry” settings, if the contents of the ref-
erenced numeral memory tables change, the graph becomes discontinuous.
Example: