396
Graphs
Section 7-10
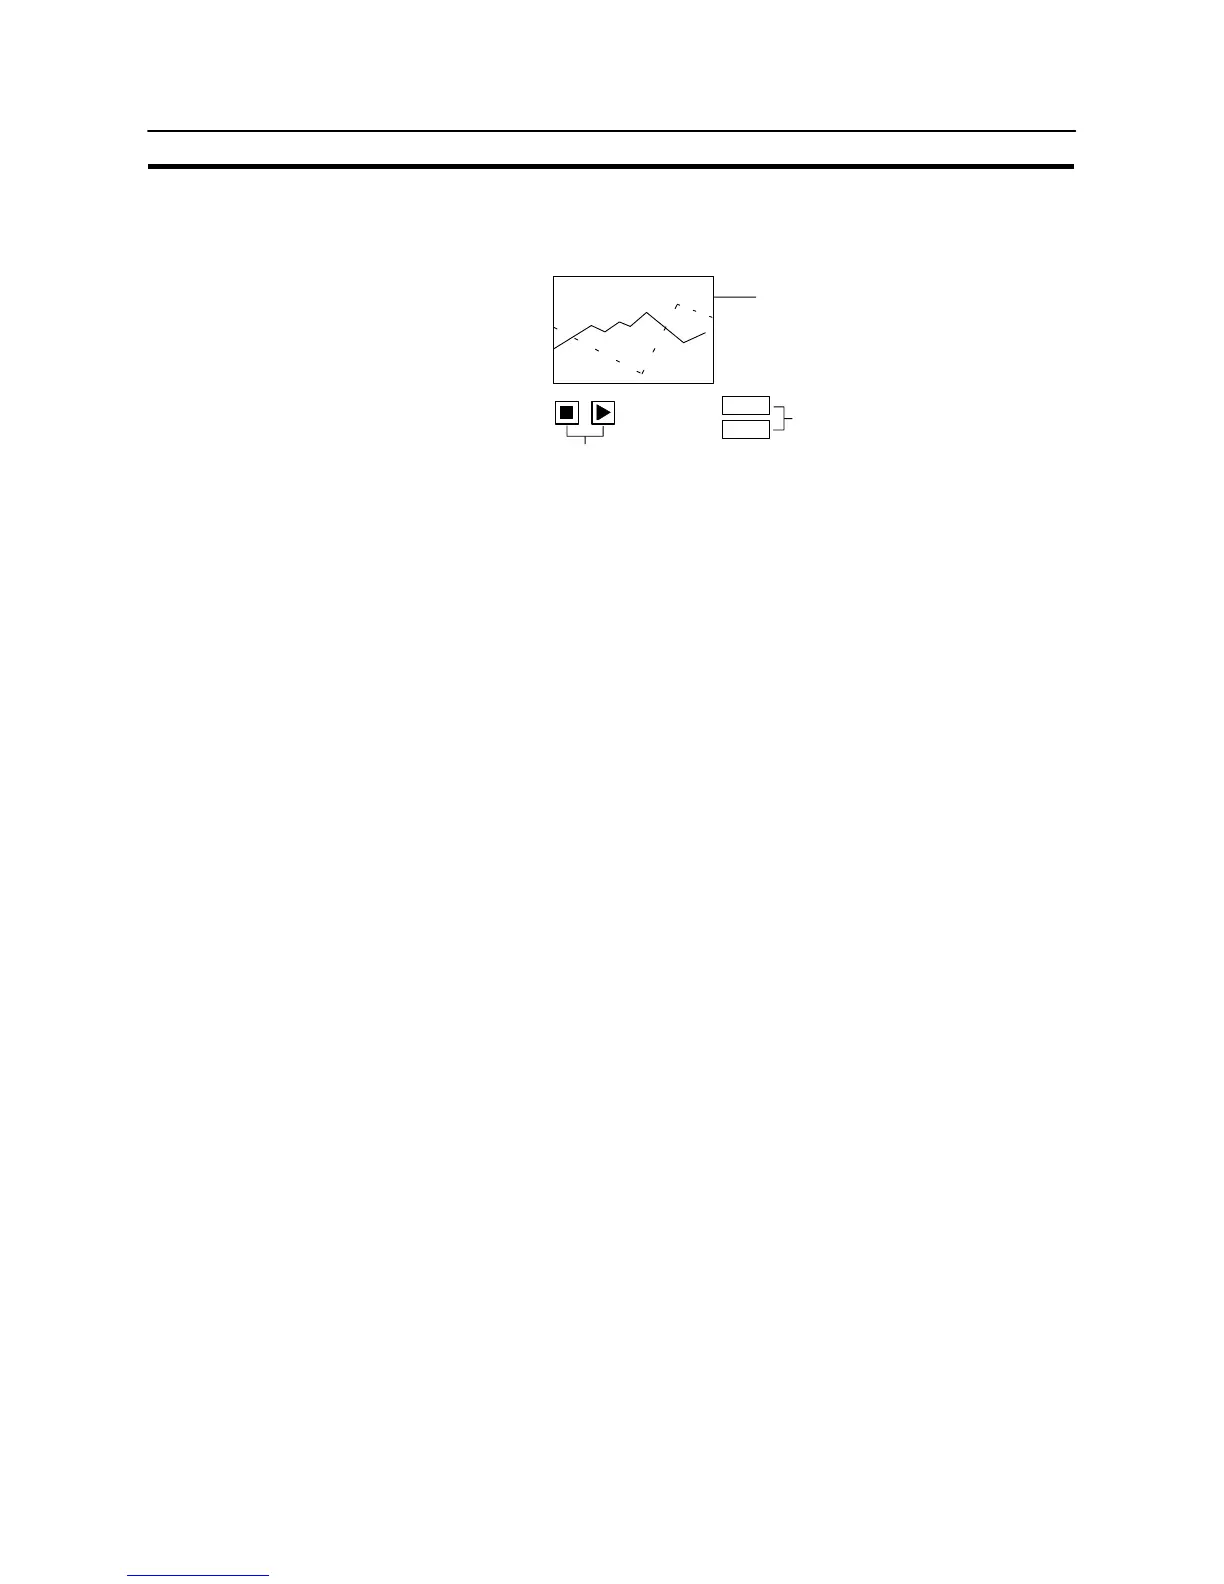
S Display elements of trend graph
A trend graph consists of three display elements. Except for the graph area, it is
possible to choose whether or not the element is displayed.
75%
48%
Area in which the graph is displayed
Percentage value of the latest data
Touch switches for controlling the graph display
<Graph area>
The display method is determined by the setting made for the “General” proper-
ties of the trend graph.
<Percentage value>
This is displayed when a check mark is set for “Display %” in the “Settings” (prop-
erties of each line) settings.
The display method is determined by the “Display %” property. The position,
size and color can be chosen as desired. “Standard” must always be set for ”Dis-
play Attribute”.
<Touch switch>
Whether or not the touch switches are displayed can be determined by the set-
ting made for “Touch Switch of Display Function”. The touch switch position can
be changed; the size and the color cannot.