397
Graphs
Section 7-10
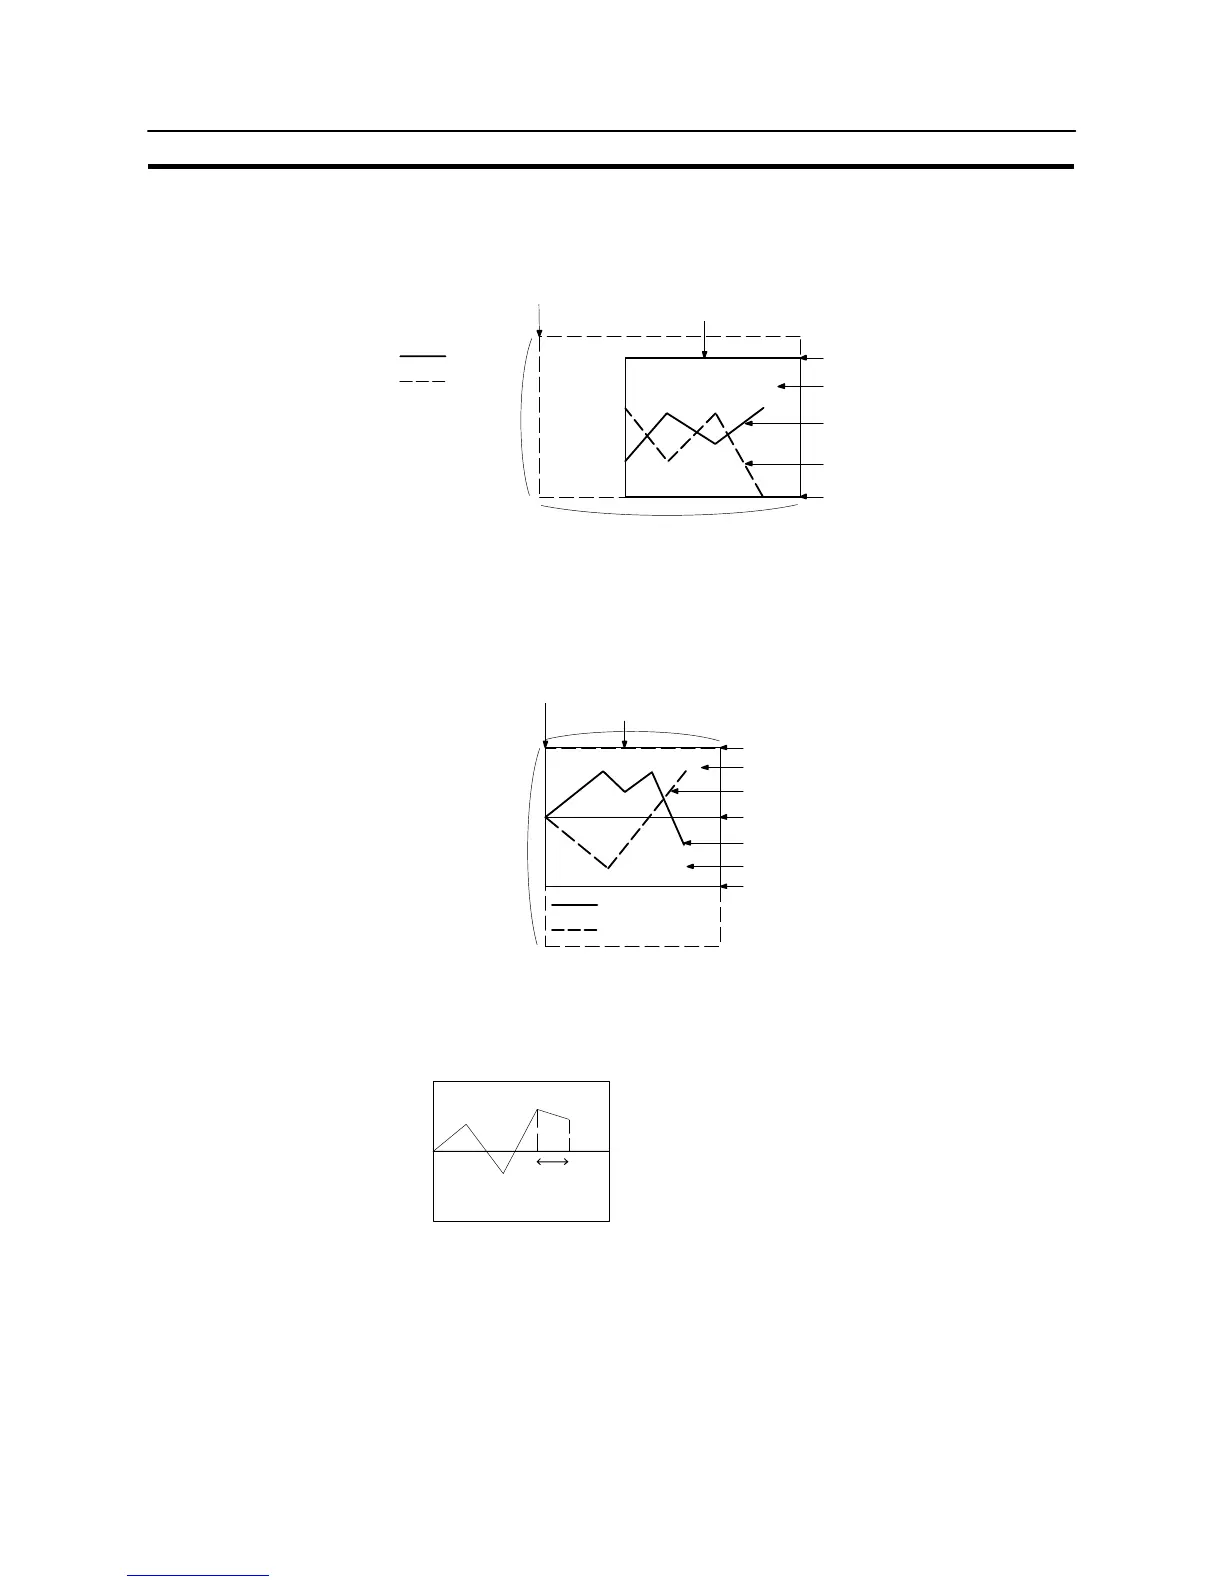
S Resulting display
<When no check mark is set for “Display Sign”>
Size (X direction)
Position
(Top left corner of the rectangular area including the
graph, percentage display, and touch switches)
Frame color
Latest data 80%
100% position
Display color for the + range
Size
(Y direction)
Line (color, style)
0% position
Line (color, style)
Latest data −120%
<When a check mark is set for “Display Sign”>
In this case, the center of the graph is always the 0% position, regardless of the
settings made for “100%”, “0%”, and “−100%”.
Position
(Top left corner of the rectangular area including the
graph, percentage display, and touch switches)
Frame color
Size (X direction)
100% position
Display color of + range
Line (color, type)
0% position
Size
(Y direction)
Line (color, type)
Display color of − range
−100% position
Latest data −50%
Latest data 80%
S Drawing width
The drawing width is the interval at which successive data are drawn in the direc-
tion of motion. If a value outside the display area of the graph is specified, the
graph will not be displayed.
Direction of motion →
Drawing width