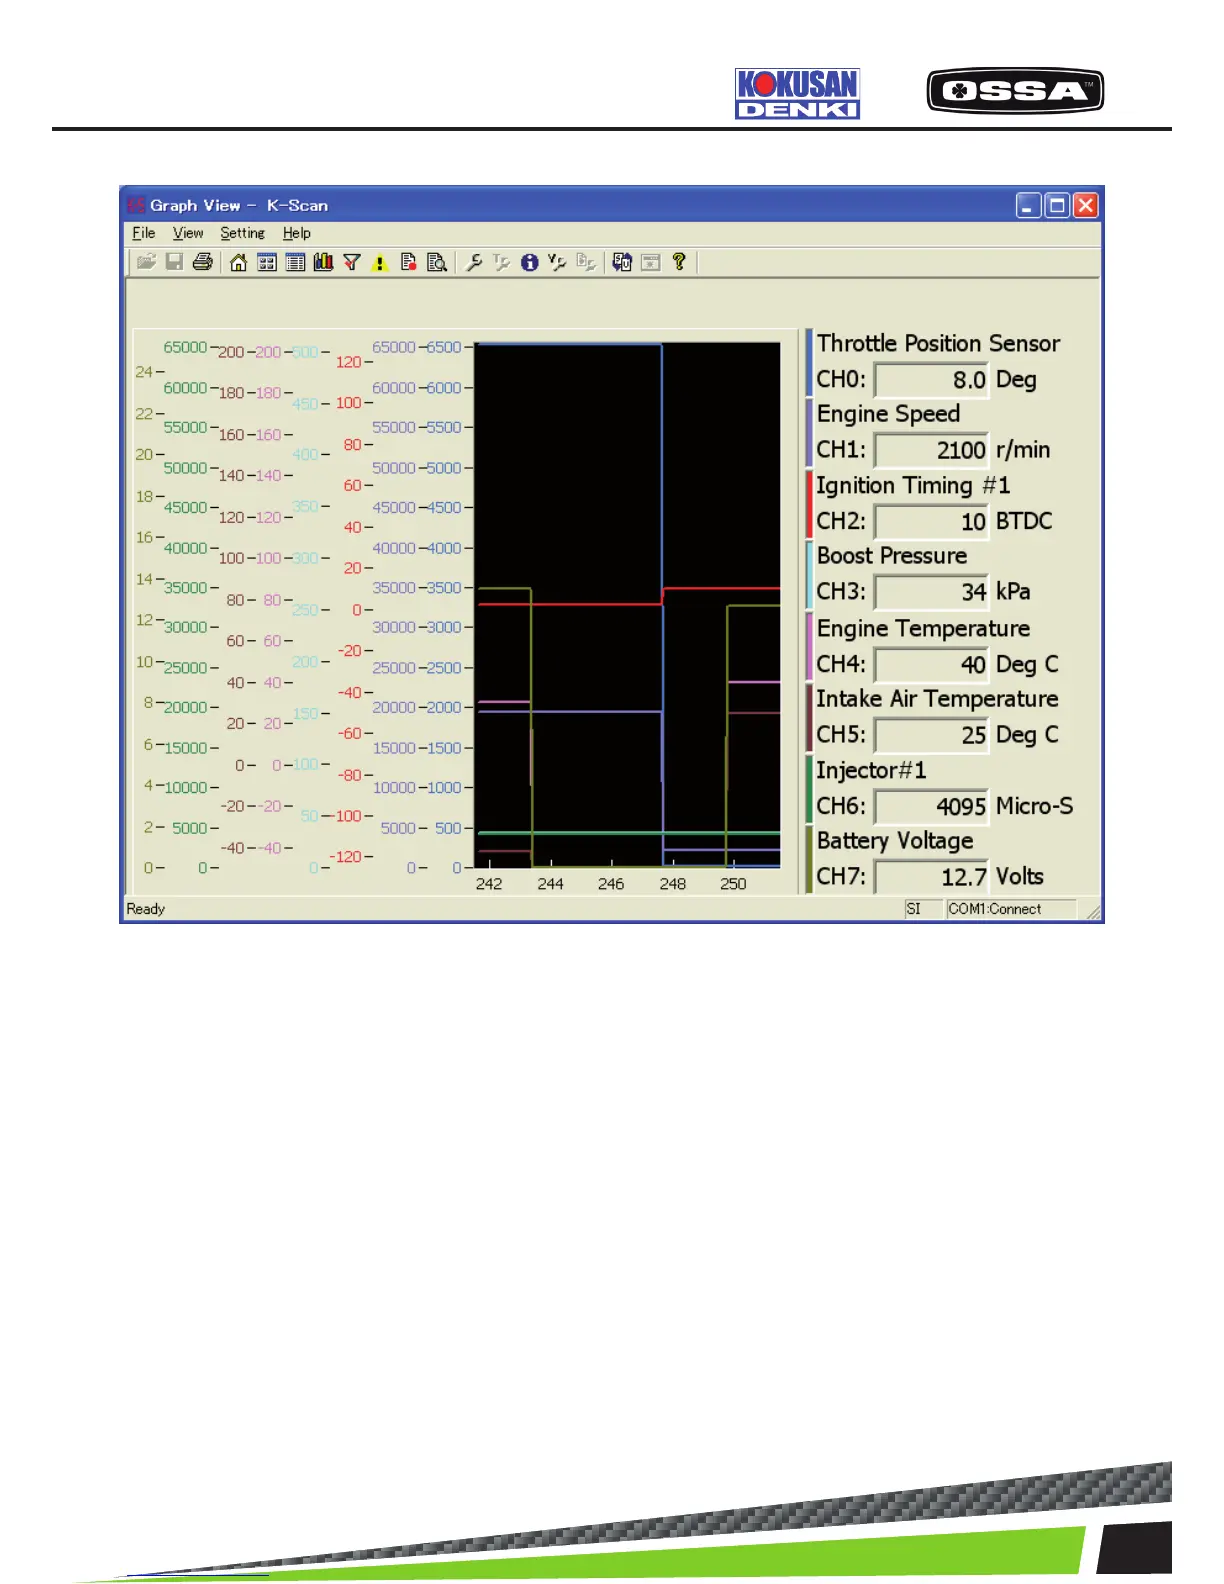
Figure 7 Graph View(Overlay) Screen
1 Graph Display sensor values of Data Items by graphs.
These graphs keep sensor values for 10 seconds.
Leftpart of the graph will be discarded and the other
partswill be shifted to the left after 10 seconds.
These graphswill be cleared when you move to other
screens.
2 Selected Data Item Display a current value of Data Item.
3 [Toolbar] Print Print a screen image.
4 [Toolbar] View Setting button Show Graph Setting dialog.
5 [Toolbar] Unit Switch button Switch unit mode.
6 When this screen is displayed When the ECU is not connected, the ECU
connectionwill be started. If failed to connect to the
ECU, themessage 7 will be shown
KSCAN