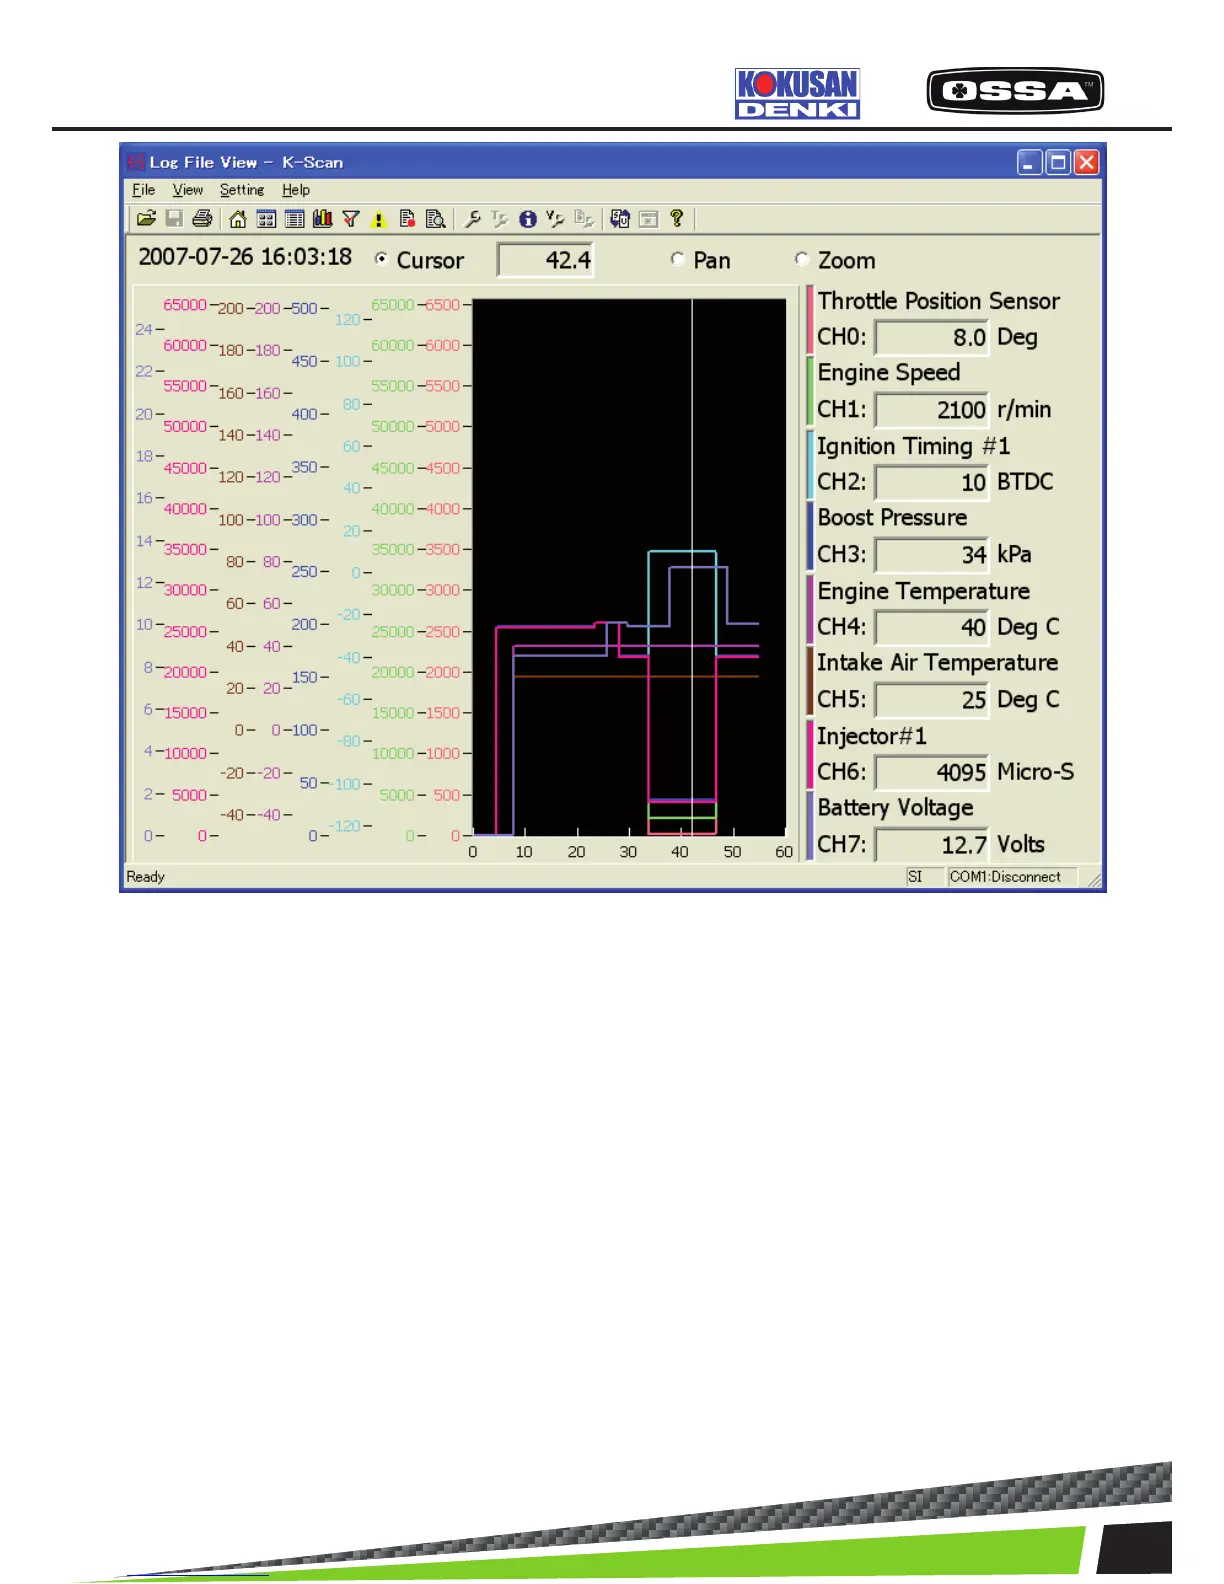
Figure 15 Log File View(Overlay) Screen
1 Date/Time Display date and time in a log le.
2 Graph Display sensor values of Data Items.
There is no limitation to the x-axis that means time
span.
3 Operation Mode Set mouse operation mode on graphs.
When [Zoom] is selected,plot areas of graphs will be initia
led.
Cursor: You can drag a cursor to display the sensor values
at the cursor position. A passed time at the cursor position
will be displayed in the text box.
Pan: You can scroll graphs by dragging a plot area.
Zoom: You can drag a plot area to zoom in plot area.
You can also click a plot area with [Shift] key to zoom
out.
4 Selected Data Item Display a value of Data Item at the cursor position.
5 [Toolbar] View Setting button Show Log File View Setting Dialog.
6 [Toolbar] Print button Print a screen image.
7 [Toolbar] Open Log File button Show common dialog to open a log le.
KSCAN