24
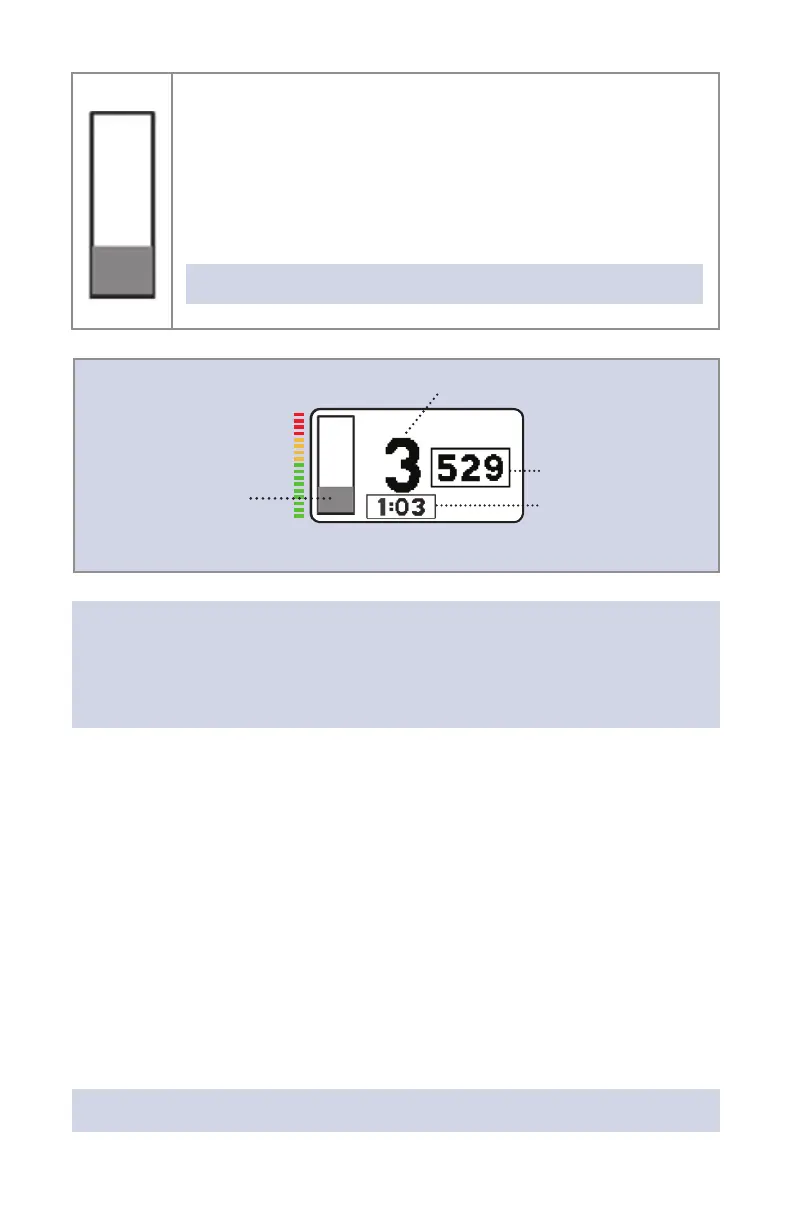
The Pulsating Bar Graph on the left side displays Pulse Amplitude
calculated as average peak amplitude pressure sample in last 5
seconds, minus amplitude pressure sample in last 5 seconds. The Bar
Graph is a visual representation better reecting AIP and AEP values
and represents an estimate of airway pressure. PEEP is represented by
a solid bar at the base and AIP is represented by the pulsating peaks
of the Bar Graph display.
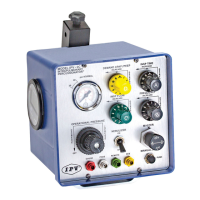
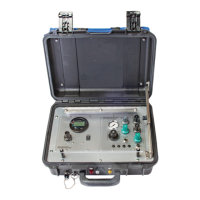
Model: EUR Therapy
Device: IPV®-2C (Non-USA)
Display Metrics: Pulse Frequency Rate, Mean Airway Pressure,
Session Usage Time, Pulse Amplitude Pressure.
At 16 seconds, the PDM enters Active mode. The timer bar will change to a numeric
display, showing the current usage Session Timer. Above the timer reading is the display
of the Pulse Amplitude. This is calculated from the pressure measurements at the
moment of instantaneous peak and trough amplitude averaged over 5 seconds. The
display on the right shows the currently measured Pulse Frequency rate.
Mean Airway Pressure (MAP) averages Pulse Amplitude over 5 seconds. At 100 samples
per second, this is an average of 500 measurements.
The PDM displays the usage Session Timer in minutes and seconds. The Session Timer
is the total time of the current usage. The Session Timer can display a maximum of
59 minutes and 59 seconds.
If usage has been stopped for more than 5 minutes, the Session Timer will reset and start
over.
NOTE: To display most recent usage duration time, see Report Mode.
NOTE: To display most recent usage duration time, see Report Mode.
Pulse Frequency
Rate
Usage Timer
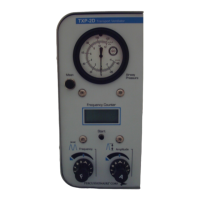
US IPV: IPV®-2C
Bar Graph measuring
pulse amplitude
(0-50 cmH
2
O/hPa)
Increments
2.5-3 cmH
2
O/hPa
Mean Airway Pressure
50
0
30