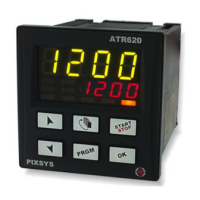
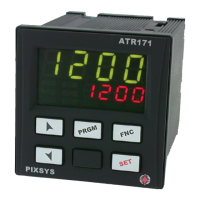
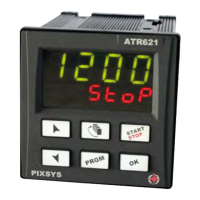
25.1 Numerical indicators (displays)
1
GREEN
Visualize usually process value (ex. Value
read by thermocouple), but may also
visualize setpoint value, time elapsed after
cycle start
1
, step number
2
, percentage
value of output , value of entering parameter
during configuration
15
.
2
RED
Visualization on this dispay is programmable
and may be chosen as setpoint value,
elapsed time or step/cycle in progress.
Visualize number of entering parameter
during configuration. VisuaIize Step-
(ex.:01-T) or step-setpoint (ex.:01-S) which is
being entered during cycle programming.
1
Example for 1 hour, 5 minutes
2
Example for step no. 3
15
See chap.26