RT-7600S Auto Hematology Analyzer User’s Manual
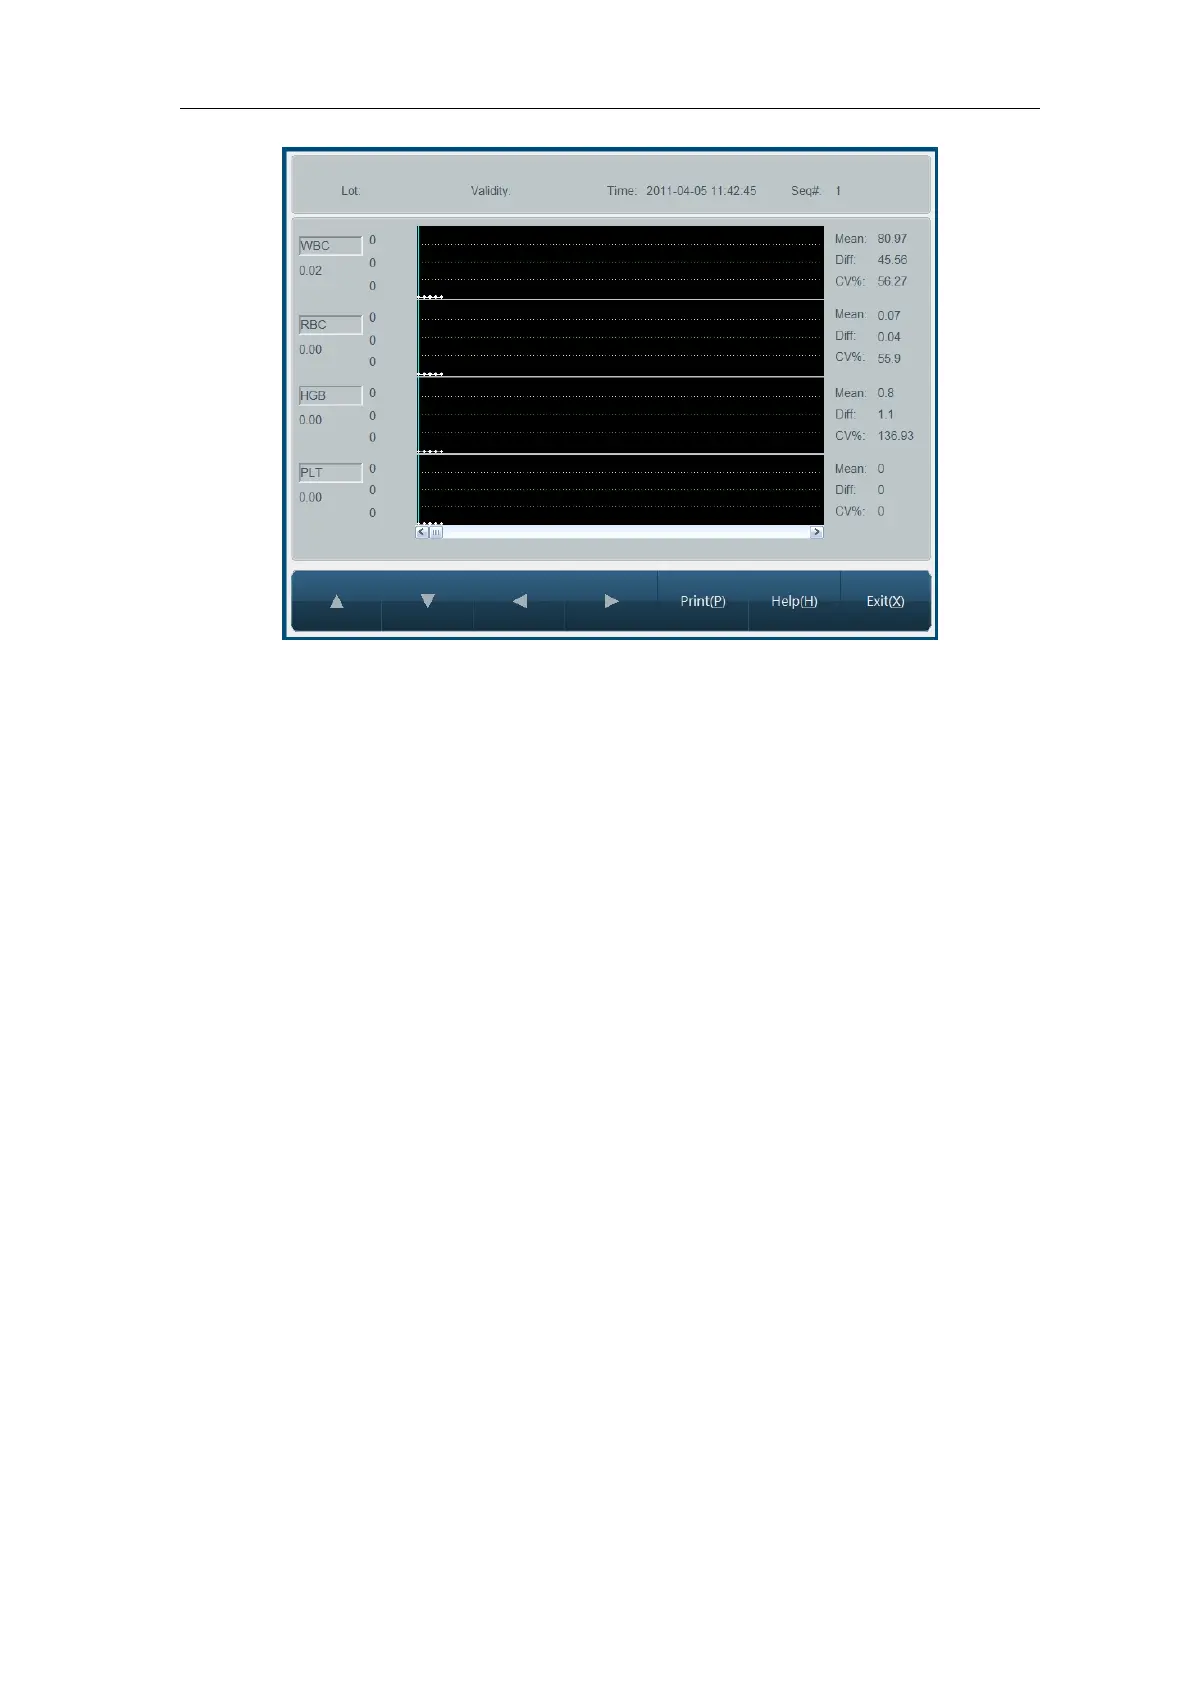
Fig.4-6 L-J QC chart
Lot No.: lot Number of QC sample corresponding to QC file.
Expiry: validity period of QC sample.
Time: test time of datum corresponding to QC point.
Seq#: sequence number of current QC point in all QC data points.
Each screen displays four-parameter QC chart, Mean (average), Diff (standard deviation),
CV (variation coefficient) of each parameter.
Three values on the left of QC chart are, from top to bottom: QC sample target value +
deviation, QC sample target value, QC sample target value - deviation, respectively.
Press “↓”, “↑” keys on keyboard or frame to switch between items.
Press “←”, “→” keys on keyboard or frame, QC data of different sequence Numbers can be
shown.
Press “Print” button to print out one current group of QC data.
4.2 X-B QC
X-B QC does not use QC sample, same as QC of QC sample, it belongs to instrument quality
monitoring method, they can reflect machine inspection quality from different aspects, and
not interchangeable. X-B QC data stem from random sample, not classified according to
disease type. The given value and upper and lower limits comprise a reference range,
observe trend of each lot of X-B values in reference range.
The instrument makes X-B QC of all 20 parameters, quantity of samples for X-B numeric
analysis in each lot is within 20-200, the default is 20.