Appendix
SP 305
Startup 250:Users:Danny:Desktop:Operation manuals:line pumps:maverick
(P305):Appendix.fm
Operation Manual -
75
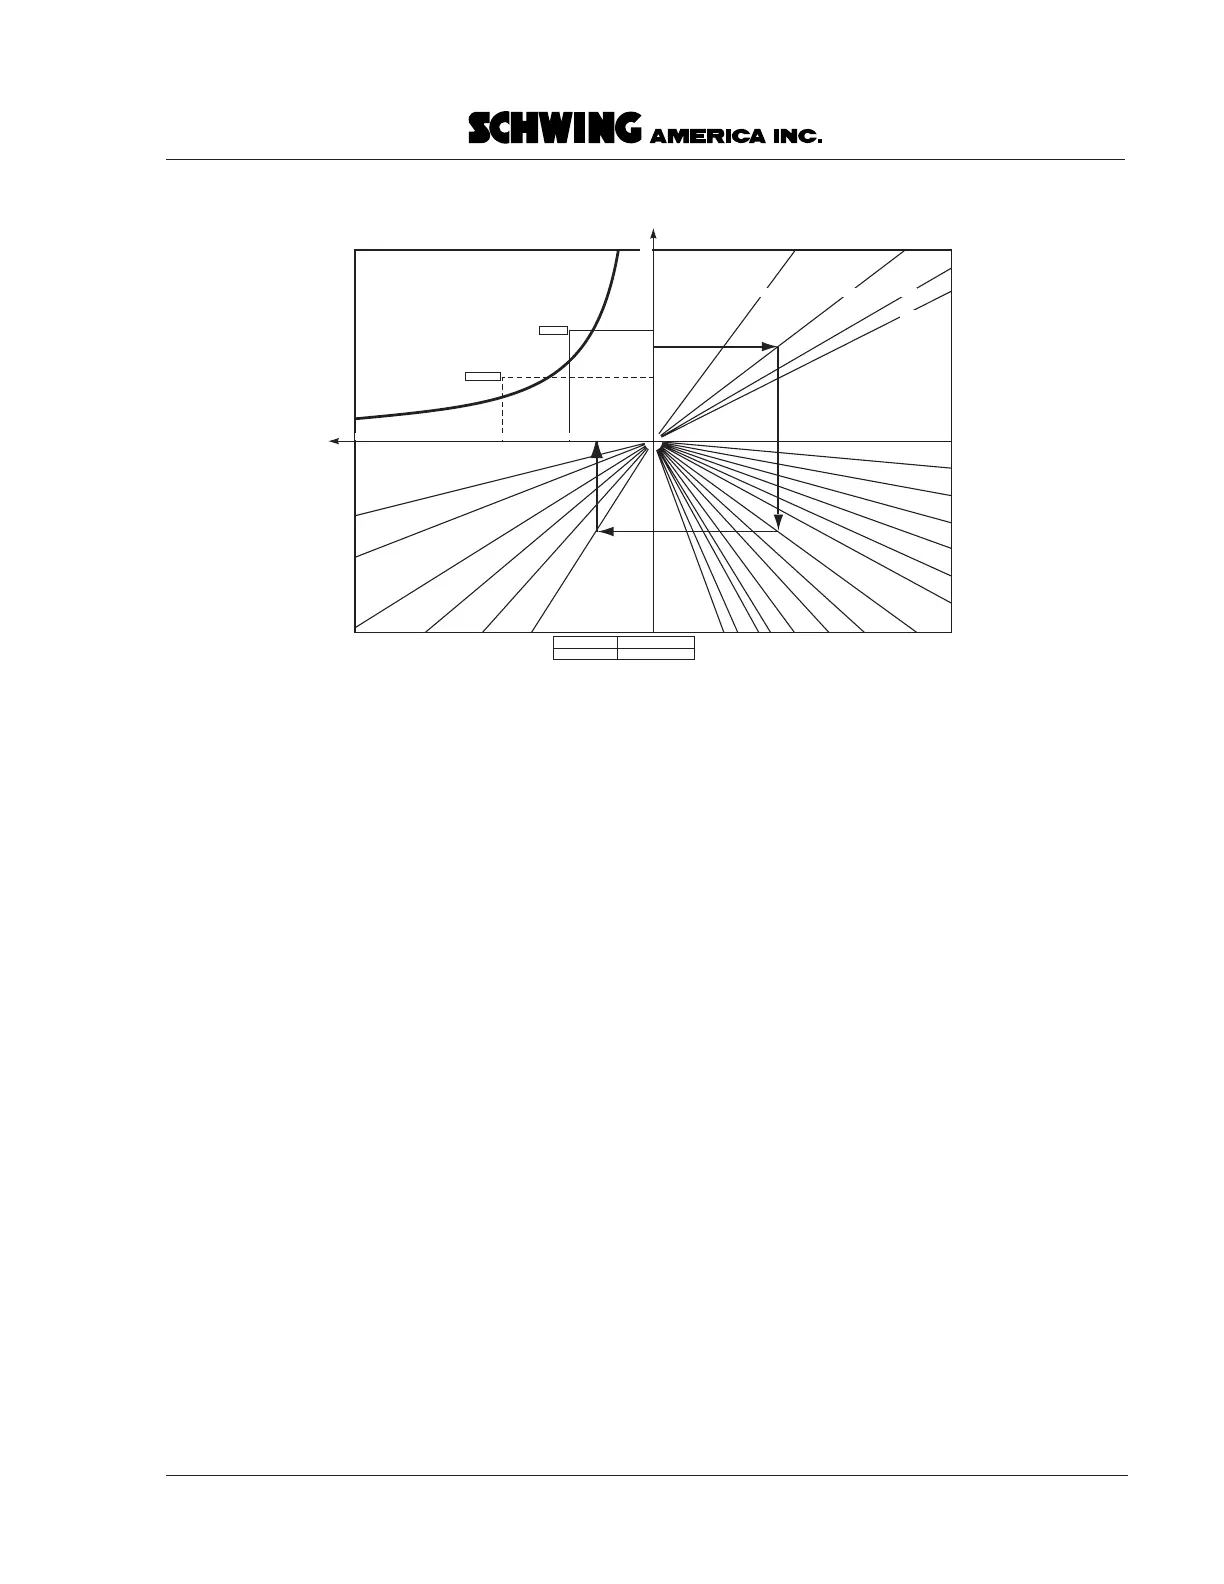
The upper left quadrant is the beginning and end point
of the graph, and it shows maximum output, pressure,
and power for a specific machine. The upper right
quadrant accounts for the relationship between
concrete output and pipeline diameters. The lower right
quadrant accounts for the resistance to flow of the
entire pipeline system. The lower left quadrant
accounts for the pumpability of the concrete.
To use the nomograph, you begin at output required
and move clockwise until you encounter the lines that
represent your job situation. Each time you meet the
line that applies, you make a 90° turn until you come to
a point on the bottom of the upper left quadrant that
shows pressure required (Figure 50).
To illustrate the use of a nomograph, we will use a
hypothetical job situation with the following
specifications:
1. We will need an average output of 75 cubic yards
per hour, but we will be pumping only 75% of the
time. The rest of the time will be spent moving
hose, removing pipe lengths, waiting for concrete
trucks, and taking care of miscellaneous jobs. This
means that when we are actually pumping, we will
need an output rate of 75 ÷.75 = 100 yd
3
/hr.
2. We will use 5-in.-diameter pipeline.
3. We will need the following pipeline lengths:
Separately laid pipeline:
• 40 ft. of 5-in. rubber hose
• 150 ft. of 5-in. horizontal steel pipe
Boom pipe, elbows, and deck system:
• 13 ft. of 5-in. rubber hose
• 144 ft. of 5-in. steel pipe (on the boom and
pump deck)
• 5.25 ft. of 6–to–5-in. reducer (on the pump)
• 4 5-in. 45° elbows, radius 250 mm
• 11 5-in. 90° elbows, radius 250 mm
• 2 6-in. 90° elbows, radius 250 mm
4. We will specify a slump of 5-6 in. and use the 5-in.
line on the chart.
5. In addition, when we add the pressure for the
vertical run, we will have to add 1.1 times 70 ft =
77 PSI.
All of these criteria will be explained in detail as we go
through the individual quadrants.
100
2000
200
300
400
500
600
80010001200
1500180025003000
2"
2.5"
3"
4" 5" 6"
P in PSI
Q in yd
3
/hr.
Pipeline diameter in inches
Proportional value of pipeline in feet
For vertical placing,
add 1.105 PSI per foot
of level difference.
Slump of fresh concrete in inches
6" 5" 4.5"
4"
8701566
6003000 2800 2600 2400 2200 2000 1800 1600 1400 1200 1000 800 400 200
200
180
160
140
120
100
80
60
40
20
67
116
Rod side
Piston side
120/80 x 1600:200
132 KW
Pumpkit Model:
Power:
132 KW
(72600)
TK number does not apply to truck mounted units.
Curve shown is the Power Factor number (PF).
000455.eps
Figure 50
Moving around a nomograph