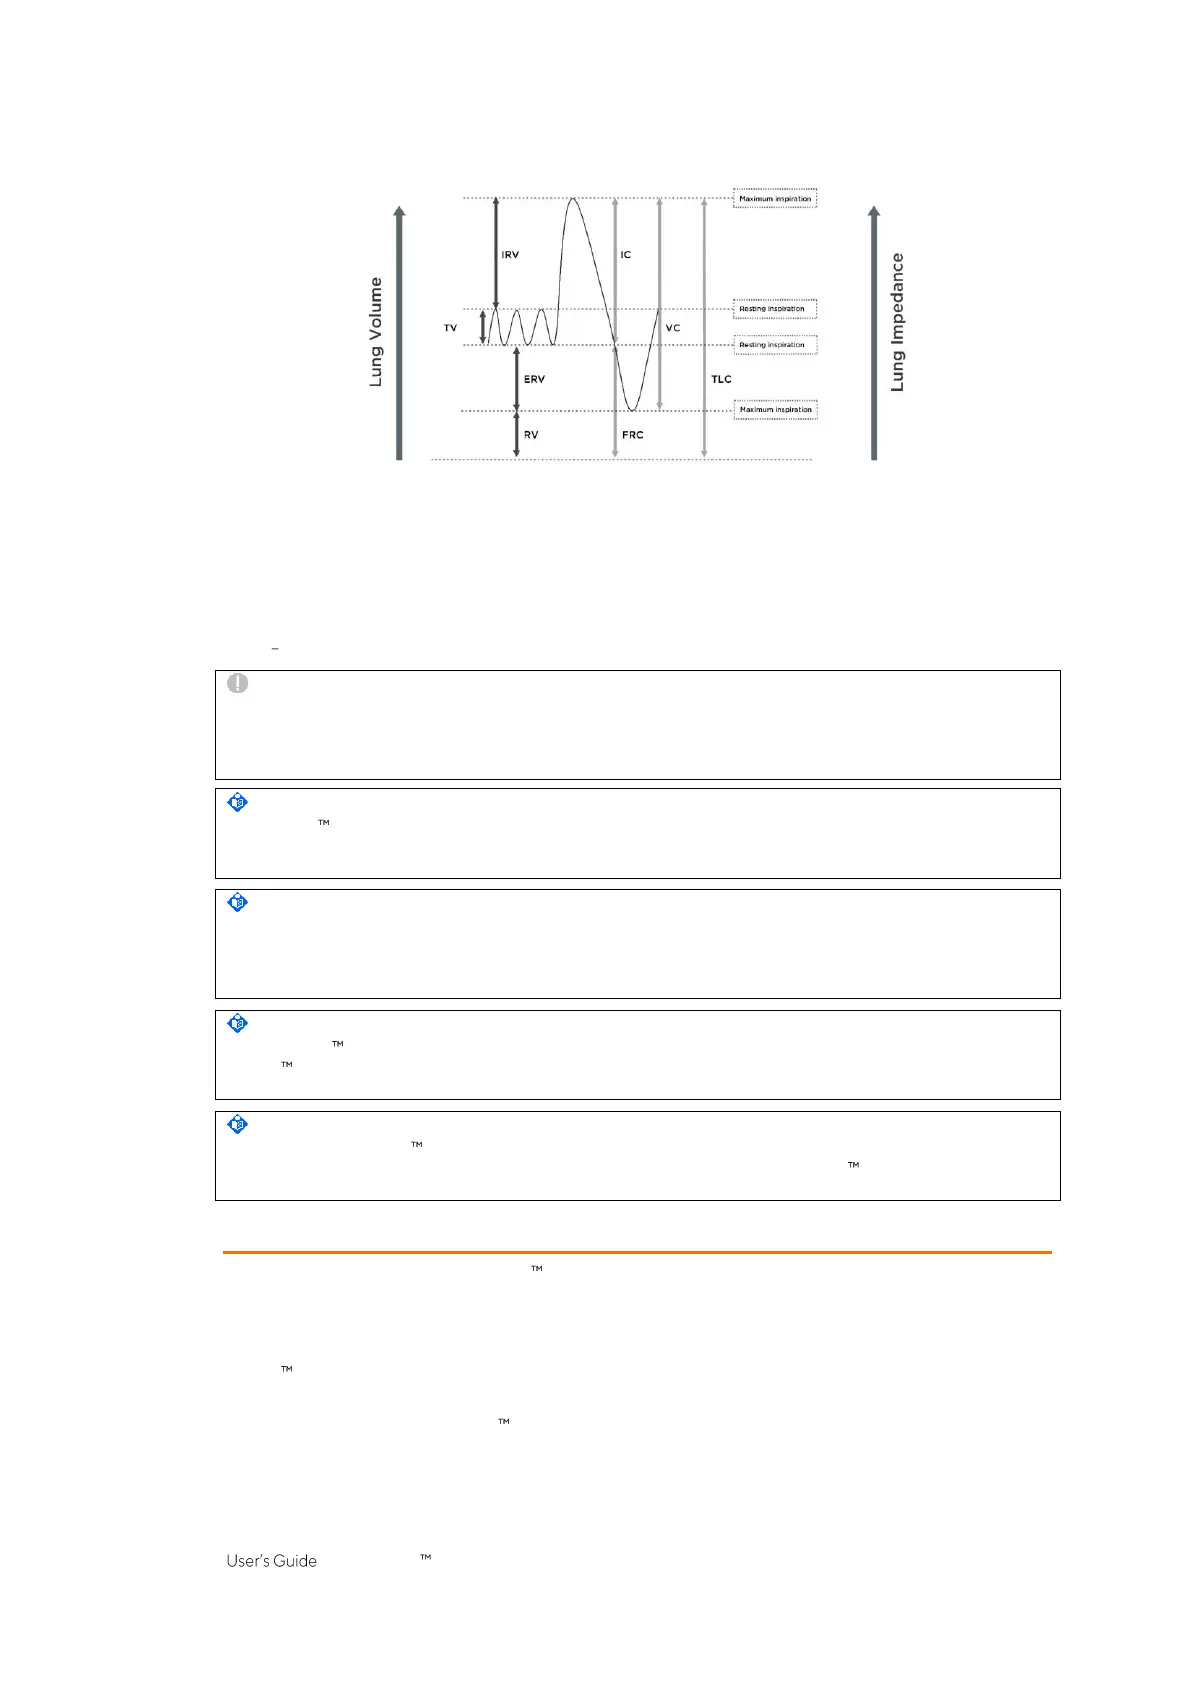
Figure 9-7: Representation of lung volumes during normal breathing and forced full inspiration and expiration (image
adapted from [8]). The measured Lung Impedance increases with lung volume, and vice versa.
Cardiac-related
Lung Impedance
changes have up to approximately 1/10 of the magnitude of
Lung Impedance
changes caused by normal breathing and therefore might also be visible in the
Plethysmogram
. In Figure 9-6,
where smaller
Lung Impedance
changes are superposed on the
Lung Impedance
change caused by a breath
when breathing normally, this is indeed the case. It is quite evident that with decreasing tidal volume the
magnitude of cardiac-related compared to breathing-related
Lung Impedance
changes will gradually increase.
In case of very small or no tidal volumes - as this may be the case in very shallowly breathing patients, in patients
being ventilated at frequencies above a few Hz or on extracorporeal lung support or during apnea or breath
holds cardiac-related
Lung Impedance
changes will typically dominate the
Plethysmogram
.
CAUTION
To avoid misinterpretation of results, be aware that in some situations
Lung Impedance
changes displayed by
the
Plethysmogram
may be less related to breathing than to other sources such as cardiac activity, therefore
one should not rely solely upon the visual representation of the
Plethysmogram
, i.e. the
Lung Impedance
waveform
, to derive information on breathing.
NOTE
The LuMon Monitor displays the
Plethysmogram
auto-scaled and therefore only shows relative
Lung
Impedance
changes. Consequently, the absolute magnitude of breathing- or cardiac-related
Lung Impedance
changes are not displayed, however their relative magnitude can be visualized in relation to each other.
NOTE
If in doubt whether the
Lung Impedance
changes displayed by the
Plethysmogram
are predominantly
breathing-related, cardiac-related or mixed, consider comparing the
Plethysmogram
with other breathing or
cardiac-related
waveforms
or data available for the same patient measured by other devices such as ventilators
or patient monitors.
NOTE
As the LuMon Monitor partially filters out frequencies above a few Hertz the
Plethysmogram
displayed on the
LuMon Monitor does not show the small tidal volumes typically encountered in patients under high-
frequency oscillatory ventilation (HFOV) or under other high-frequency ventilation modalities.
NOTE
The ability of the LuMon System to detect lung volume changes depends on the dimension of the lung with
respect to the thorax. As this relationship is similar across all age groups, the LuMon System can detect much
smaller absolute lung volume changes in neonates than in adult patients.
9.5 Breath detection
In order to identify breaths, the LuMon System continuously evaluates the course of the
Plethysmogram
irrespective of the selected
Analysis Mode
(9.7). As can be seen from Figure 9-7 the
Plethysmogram
is
expected to display an increase during the inspiratory phase of a breath and a decrease during the expiratory
phase. Pairs of consecutive increase and decrease of the
Plethysmogram
are potential breaths. Those that fulfill
a set of predefined criteria are assessed as breaths, all others are rejected. As illustrated in Figure 9-8, the
LuMon Monitor in
BB mode
(9.7.1) marks the last detected breath on the
Plethysmogram
with two solid black
vertical lines.
The predefined criteria the LuMon System uses to detect breaths are selected so that, in mechanically
ventilated patients or spontaneously breathing patients with regular breathing patterns characterized by
regular respiratory rates and tidal volumes, practically all pairs of consecutive increase and decrease of the
Plethysmogram
will be assessed as breaths. If, however, the
Plethysmogram
reflects breathing patterns that
present (significant) variations in amplitude and/or frequency, only a varying number of the identified patterns
 Loading...