6.4.2 VentView trend view
The trend view of VentView displays trends of
•
End-Expiratory Lung Impedance
(EELI) (9.8),
End-Inspiratory Lung-Impedance
(EILI) (9.8) and
Respiratory Rate
(RRi) (9.6) in
BB
and
TB-I modes.
•
Aeration
(9.8) and RRi (9.6) in
TB-II mode
.
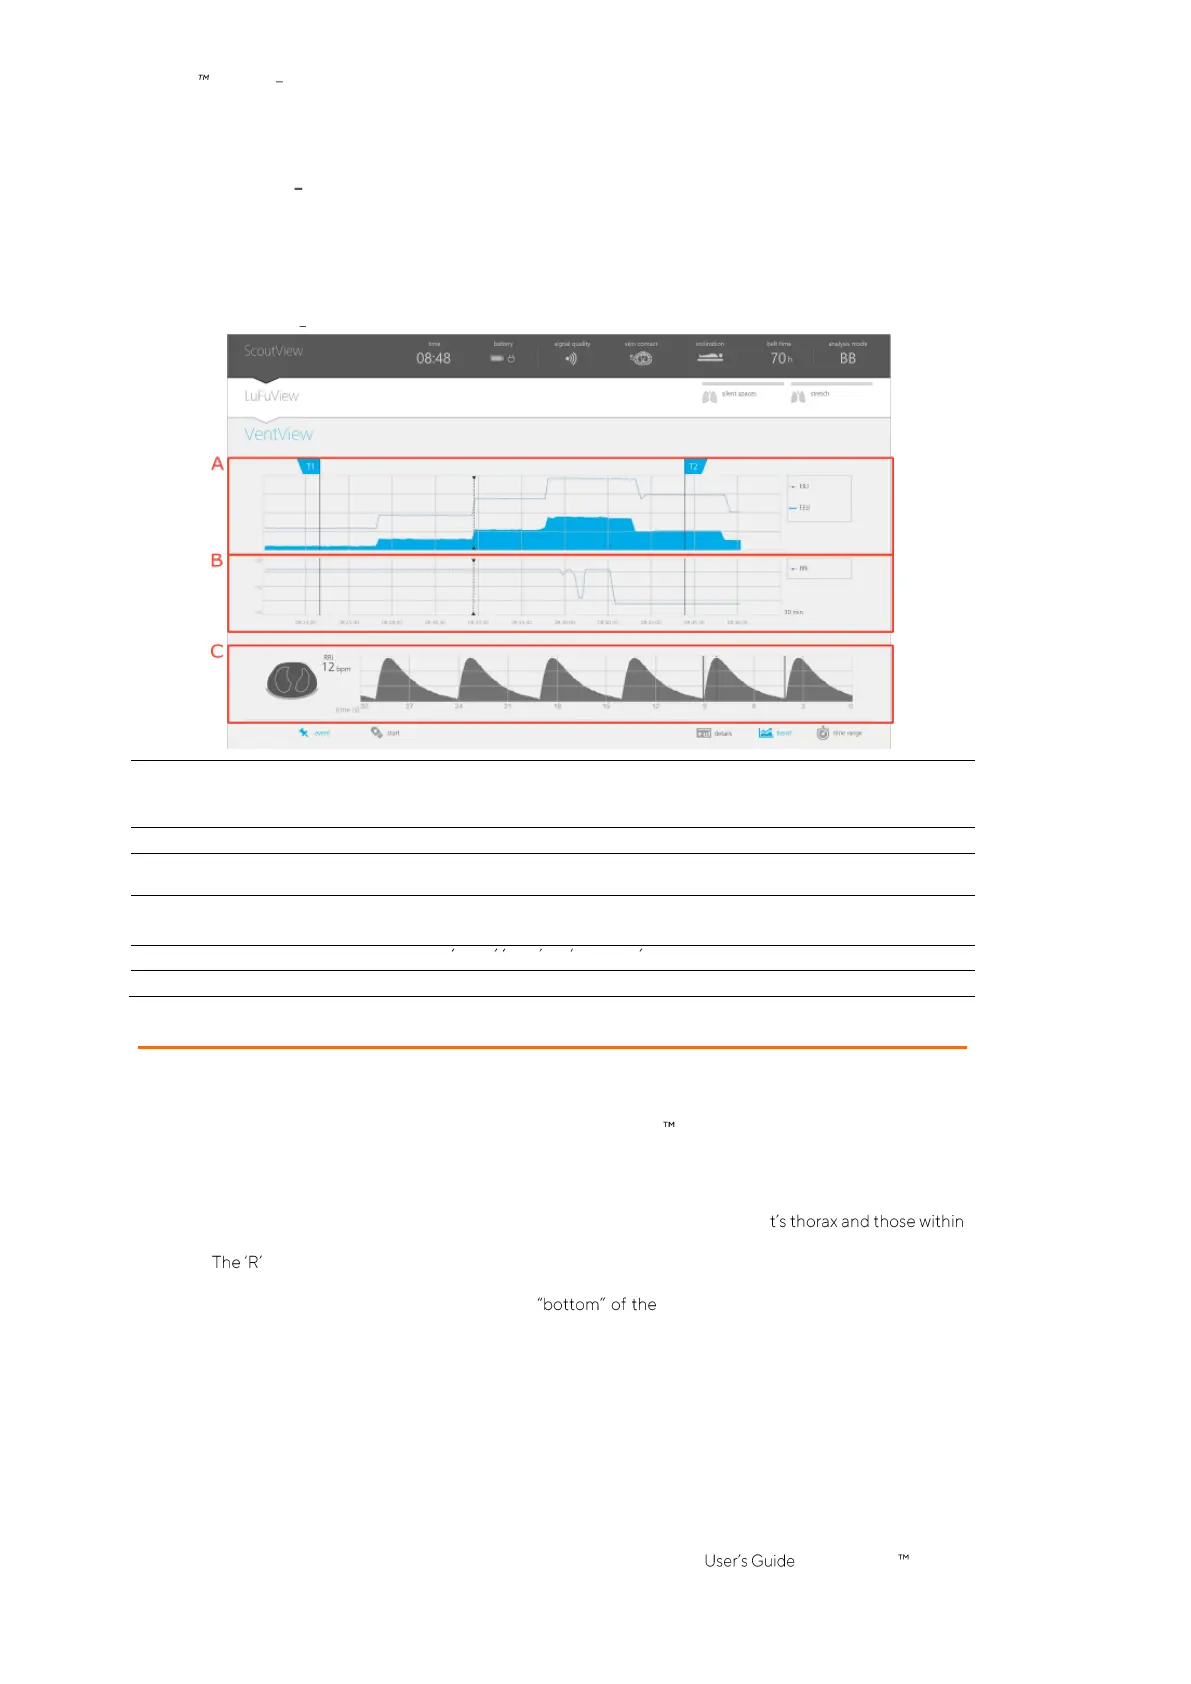
Figure 6-14: VentView trend view
A. Trends of EELI and EILI in
BB
and
TB-I modes
or of
Aeration
in
TB-II mode
In
BB
and
TB-I modes
the upper line and the lower shaded area respectively represent trends of
EILI and EELI
In
TB-II mode
the line represents the
Aeration
trend.
C. VentView real-time data
Displays the same information as the minimized VentView (Figure 6-1), i.e.
Global Dynamic Images
,
Respiratory Rate
(RRi) and the
Plethysmogram
.
The vertical axis of the above-mentioned trend charts is auto-scaled between the flags T1 and T2.
Refer to 6.5.2 for a description of the common characteristics of trends.
Refer to Figure 6-4 for a description of the buttons details , trend and time range
Refer to Figure 6-5 for a description of the GUI elements being visible on all views
6.5 Common aspects of EIT images and trends
6.5.1 Common image elements and characteristics of EIT images
As illustrated in Figure 6-15 all
EIT images
displayed on the LuMon Monitor have the following common
elements and characteristics:
• Visualization of the
Thorax
and
Lung Contours
associated with the patient-specific, CT-derived
thorax and lung models (9.1). Per definition the patient-specific models, those of the image pixels
located within the
Thorax ROI
are likely to represent areas within the patien
the
Lung ROI
areas within its lungs.
• at the side of the
Thorax Contour
indicates the right side of the patient.
• To indicate
rotation
(9.2), the
EIT images
rotate with the patient.
• The thick grey line, being displayed at the
Thorax Contour
irrespective of
rotation
,
schematically visualizes the bed.
• The black triangle points in direction of gravity.
 Loading...