time points. EILI corresponds to
Lung Impedance
measured at end-inspiratory respectively start-expiratory
time points within detected breaths. In
BB mode
, EELI and EILI are determined for each detected breath.
In TB-I mode and as illustrated in Figure 9-10 for the last completed
Analysis Interval
, EELI and EILI correspond
to the minimum and maximum of the
Plethysmogram
within
Analysis Intervals
, respectively. The minima and
maxima within
Analysis Intervals
can occur in any order. Their occurrence nevertheless is assumed to be
breathing-related and to correspond to end-expiratory and end-inspiratory time points of not necessarily the
same breath. In
TB-I mode
EELI and EILI are determined every 15 seconds, i.e. even if maximal
Lung Impedance
changes detected within
Analysis Intervals
are not breathing-related. Be aware that if this is the case, EELI and
EILI may not always be physiologically meaningful. Also be aware, that EELI and EILI values obtained with
BB
mode
may differ from those obtained with
TB-I mode
.
In TB-II mode and as illustrated in Figure 9-11 for the last completed
Analysis Interval
,
Aeration
, i.e. the mean
Lung Impedance
within
Analysis Intervals
, is determined every 15 seconds.
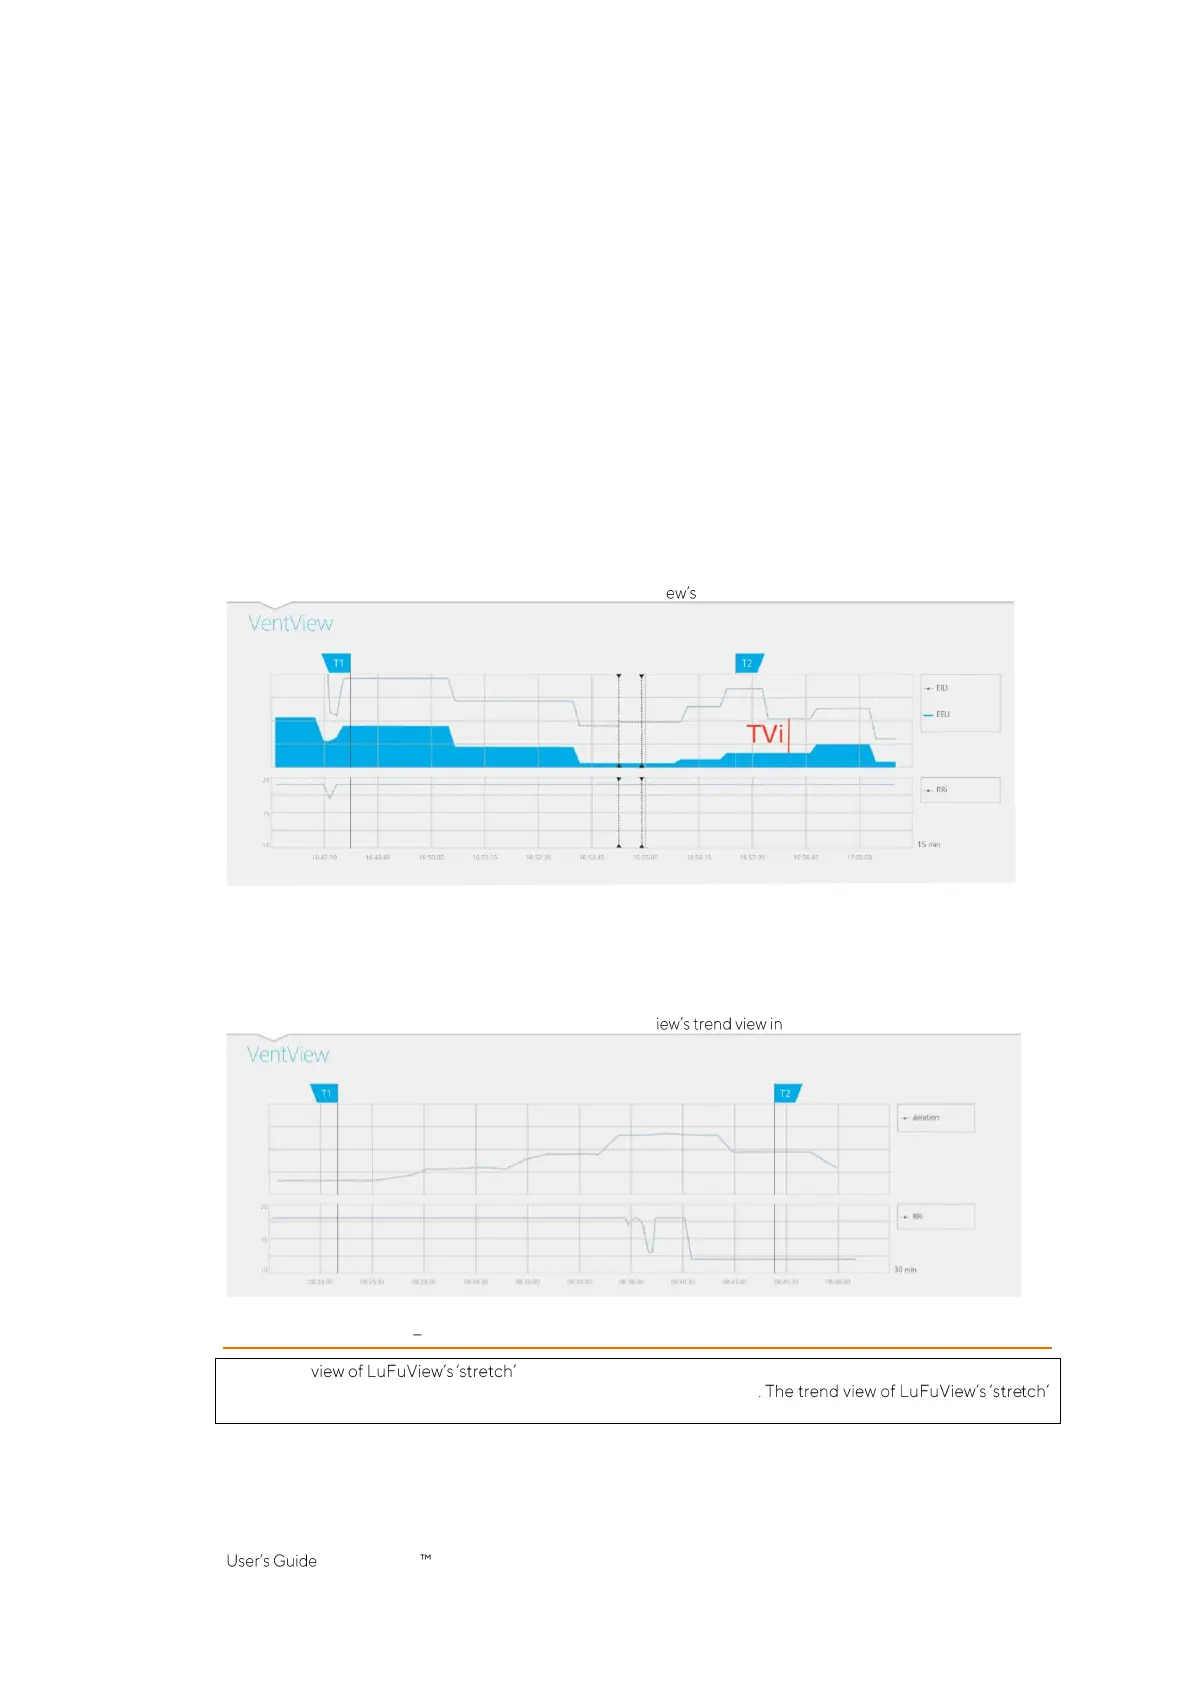
As illustrated in Figure 9-12, the trend view of VentView (6.4.2) displays the trends of EELI, EILI and RRi in
BB
and
TB-I modes
. In the upper graph, the upper border of the shaded area and the upper line represent the EELI
and EILI trends, respectively. The line in the lower graph is the RRi trend. An increase or decrease of EELI and/or
EILI is related to an increase or decrease of end-expiratory lung volume and/or end-inspiratory lung volume.
The difference between the EILI and EELI trend is related to
Tidal Variation
(TVi), i.e.
Lung Impedance
change
due to tidal ventilation. An increase or decrease in this difference is related to an increase or decrease of the
Tidal Volume.
Figure 9-12: Trends of EELI, EILI and RRi as displayed on VentVi trend view in BB and TB-I modes.
In
TB-II modes
and as illustrated in Figure 9-13, the trend view of VentView (6.4.2) displays trends of
Aeration
and RRi.
Aeration
is displayed in the upper and RRi in the lower graph. An increase or decrease of
Aeration
represents an increase or decrease of the mean lung volume.
Figure 9-13: Trends of Aeration and RRi as displayed on VentV TB-II mode.
9.9 Stretch Image Relative Tidal Stretch
The details area (6.3.1) displays the
Stretch Image
, the associated weighted
Relative
Tidal Stretch
histogram and quartiles of weighted
Relative Tidal Stretch
area (6.3.2) provides trends of the quartiles of weighted
Relative Tidal Stretch
, i.e. of its center and spread.
As illustrated in Figure 9-14, a
Stretch Image
is obtained for every
Analysis Interval
:
• by first subtracting the EELI distribution (on the right) from the EILI distribution (on the left) (yielding
as an intermediate result the change in
Lung Impedance
distribution between the respective time
points),
 Loading...