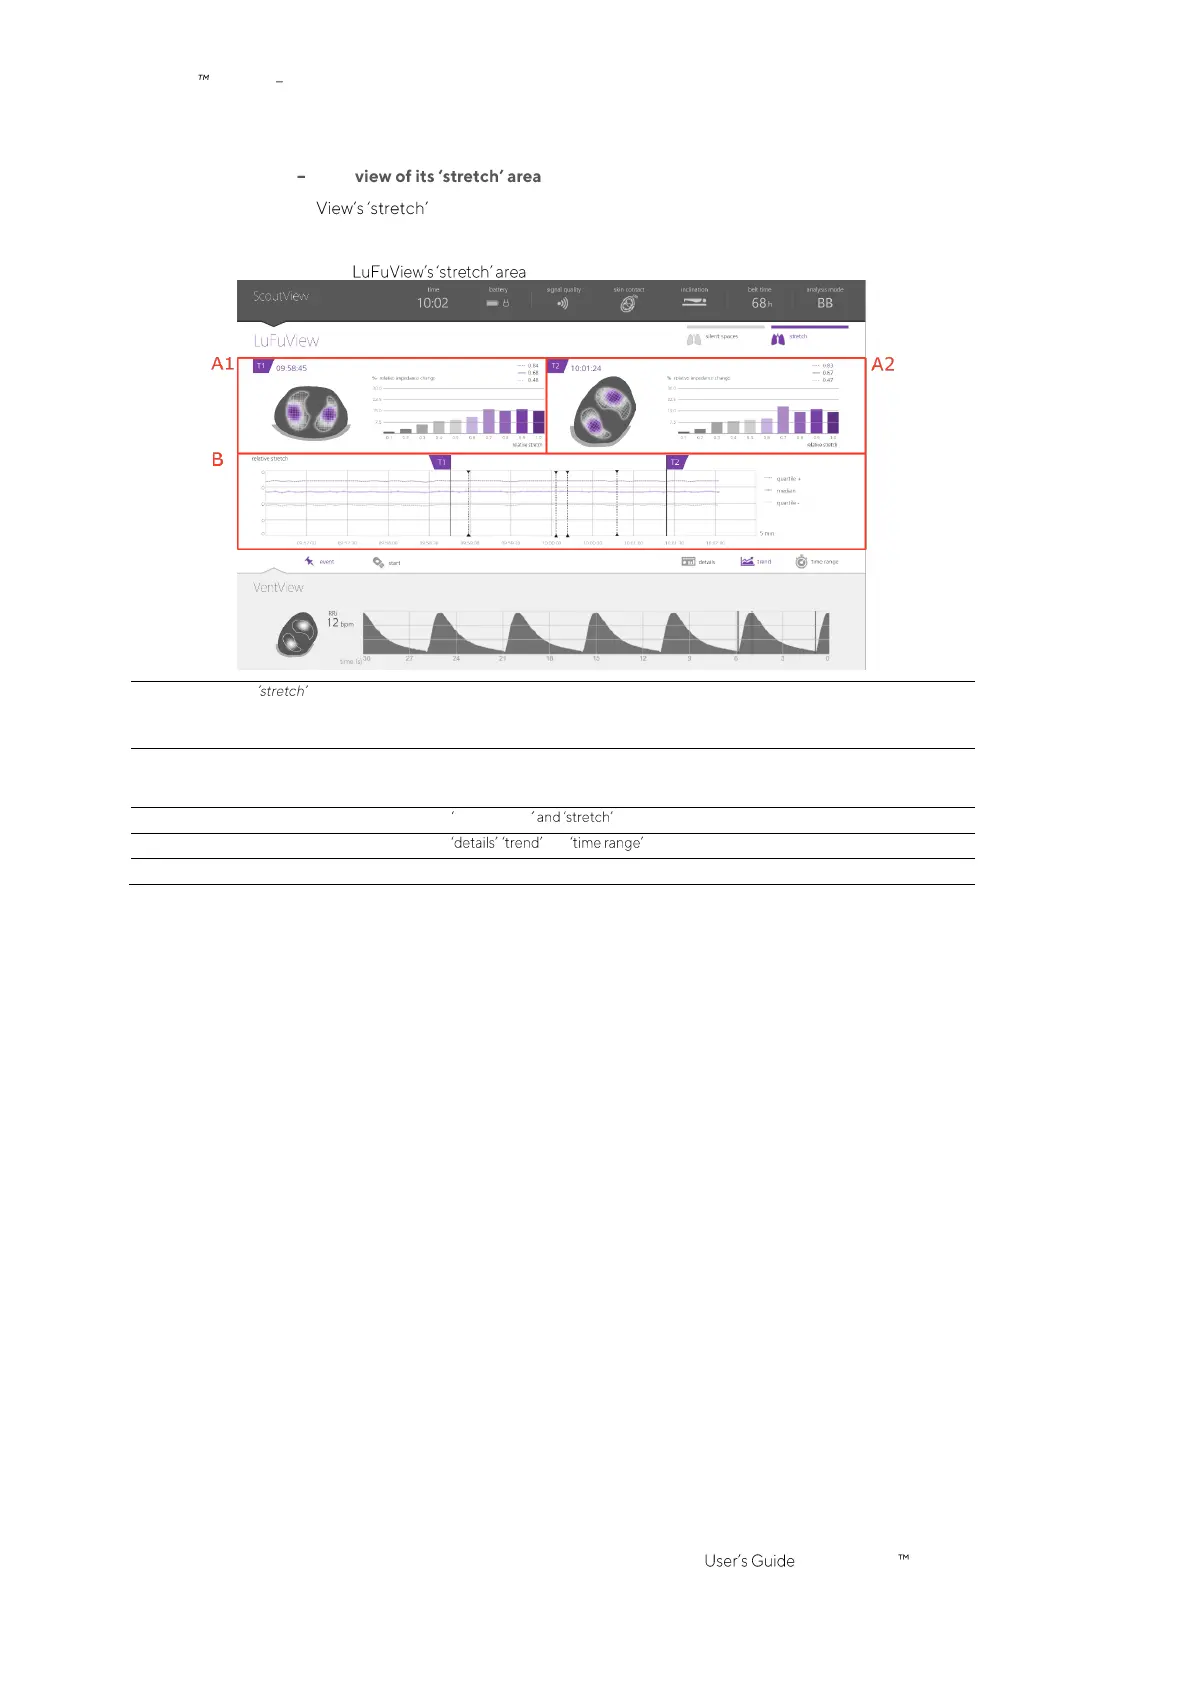
6.3.2 LuFuView trend
The trend view of LuFu area (Figure 6-10) provides trends of the quartiles of weighted
Relative
Tidal Stretch
, i.e. of its center and spread.
Figure 6-10: Trend view of the
A. Miniaturized
details views at flags T1 (A1)
and T2 (A2)
Visualize at time T1 and T2
- the
Stretch Image
(also indicating
Rotation
at the respective time)
- the weighted Relative Tidal Stretch histogram
- the weighted Relative Tidal Stretch quartiles
B. Trends of weighted
Relative
Tidal Stretch
quartiles
The three trends represent the 25% quartile (lower dotted line), the median (solid middle line) and
75% quartile (upper dotted line) of weighted
Relative Tidal Stretch.
Refer to 6.5.2 for a description of the common characteristics of trends.
Refer to Figure 6-3 for a description of the buttons silent spaces
Refer to Figure 6-4 for a description of the buttons , and
Refer to Figure 6-5 for a description of the GUI elements being visible on all views
 Loading...