6.4 VentView
6.4.1 VentView details view
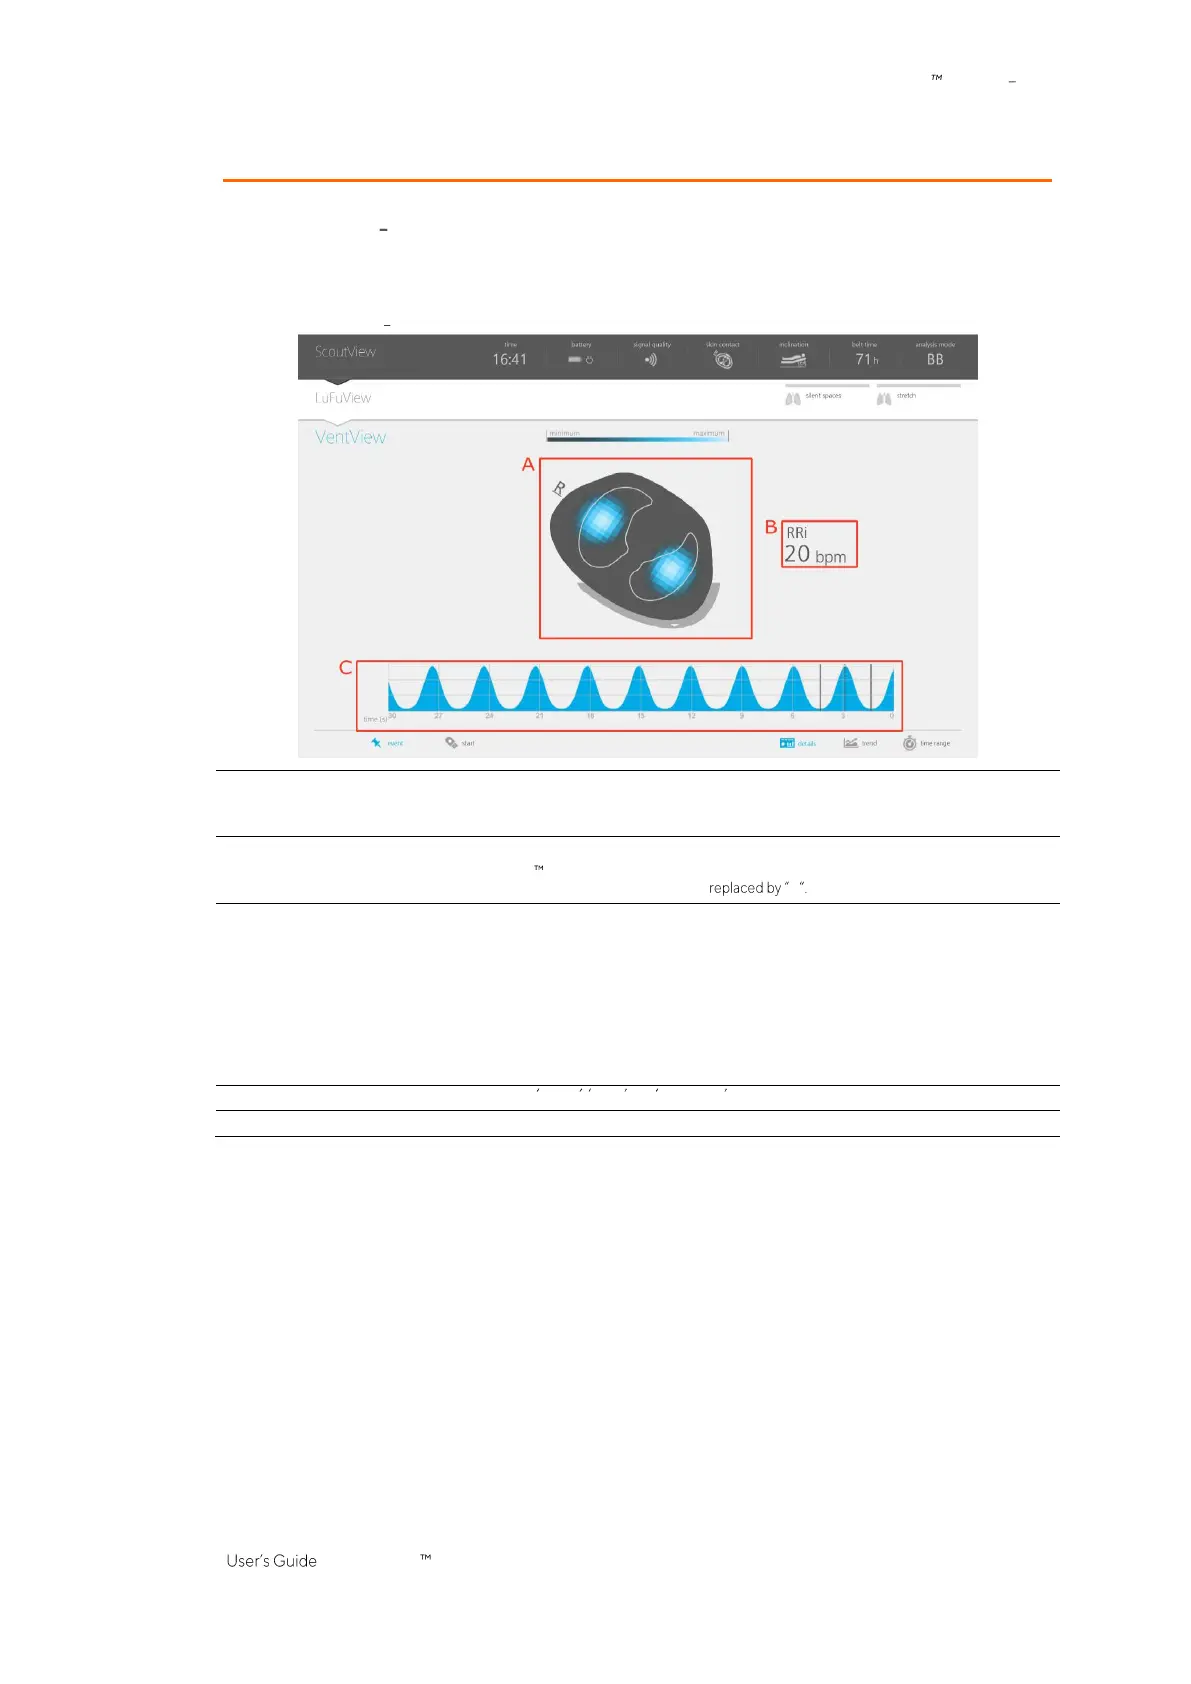
The details view of VentView displays the
Global Dynamic Image
(9.4), the
Plethysmogram
(9.4) and the
calculated
Respiratory Rate
(9.6).
Figure 6-13: VentView details view
Image visualizing the regional impedance distribution within the
Thorax ROI
. Displayed in real-
time as continuously updated series of images in a movie-like sequence (9.4).
Refer to 6.5.1 for a description of the elements and characteristics common to
EIT images
.
Impedance based
Respiratory Rate
(9.6).
If the LuMon System is unable to detect a breath, the last calculated value continues to be
displayed for up to 40 seconds and is then --
Auto-scaled
Lung Impedance waveform
moving from right to left with zero (0) being the current
time and, for example, the signal at 10 seconds corresponding to the
Lung Impedance
measured
10 seconds ago (9.4).
Solid black vertical lines identify the start and end of the most recent completed
Analysis Interval
,
i.e. the last detected breath in
BB mode
and a 15-seconds interval in
time-based
modes; broken
black vertical lines identify end-inspiratory and end-expiratory time points within the last
completed
Analysis Interval
(9.7).
Dotted black vertical lines with triangles at both ends (if any) identify operator events (9.11).
Touching the
waveform
changes from a full
waveform
style to a line style and vice versa.
Refer to Figure 6-4 for a description of the buttons details , trend and time range
Refer to Figure 6-5 for a description of the GUI elements being visible on all views
 Loading...