While monitoring the patient
NOTE
Irrespective of the currently selected
Analysis Mode
, the LuMon System in the background permanently
analyzes the measured
EIT raw data
with all
Analysis Modes
and stores or outputs the results obtained with each
mode. The selection of the
Analysis Mode
only determines for which mode the calculated results are displayed
in real time and currently accessible in the trends for review. By selecting a different
Analysis Mode
, it is,
consequently, possible anytime to review the results obtained with other modes in the trends. Should the
selected
Analysis Mode
not have been adequate during a monitoring episode, this feature permits to review
the trend data calculated with another, for the respective monitoring episode, possibly more appropriate
Analysis Mode
.
9.7.1 Main characteristics of BB mode
In
BB mode
the
Analysis Interval
corresponds to the duration of detected breath cycles. The start and end of
the last detected breath is marked on the
Plethysmogram
(Figure 9-9) with two solid black vertical lines. These
two lines also identify the two most recent end-expiratory time points. The broken black vertical line identifies
the end-inspiratory time point within the last detected breath. The corresponding values of the
Plethysmogram
are the
End-Expiratory Lung Impedance
(EELI) and the
End-Inspiratory Lung Impedance
(EILI) (9.8).
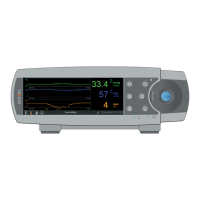
Figure 9-9: Markers on the Plethysmogram in BB mode
Lung Impedance
changes regular and breathing-related,
cardiac-related changes not visible see example (a) of Table 8-1
Lung Impedance
changes regular and mainly breathing-related,
cardiac-related changes visible see example (b) of Table 8-1
A. Last detected breath/last
Analysis Interval
B. Minimum (end of previous expiration) →
End-Expiratory Lung Impedance
(EELI)
C. Maximum (end of inspiration) →
End-Inspiratory Lung Impedance
(EILI)
D. Minimum (end of expiration) →
End-Expiratory Lung Impedance
(EELI)
E. Breathing-related
Lung Impedance
changes
F. Cardiac-related
Lung Impedance
changes (here approx. 6-times smaller than breathing-related
Lung Impedance
changes)
In
BB mode
, all
breathing-related EIT images and indices
are calculated for each detected breath. This includes
the
Stretch Image
, the
Silent Spaces Image
and
indices
such as EELI, EILI,
Functional Lung Spaces
,
Silent
Spaces, Dependent Silent Spaces, Non-Dependent Silent Spaces
and the
Center of Ventilation
(9.8, 9.9, 9.10).
9.7.2 Main characteristics of TB-I mode
In
TB-I mode
the
Analysis Interval
has a fixed, preset duration of 15 seconds. The most recent completed
Analysis Interval
is marked on the
Plethysmogram
(Figure 9-10) with two solid black vertical lines. Two broken
black vertical lines identify the minimum and maximum of the
Plethysmogram
within the most recent
completed
Analysis Interval
. The minima and maxima within
Analysis Intervals
can occur in any order. Assuming
that the marked maximum and minimum are nevertheless related to breaths, their occurrences are interpreted
as end-expiratory and end-inspiratory time points of not necessarily the same breath and the corresponding
values of the
Plethysmogram
are interpreted as
End-Expiratory Lung Impedance
(EELI) and the
End-
Inspiratory Lung Impedance
(EILI) (9.8).
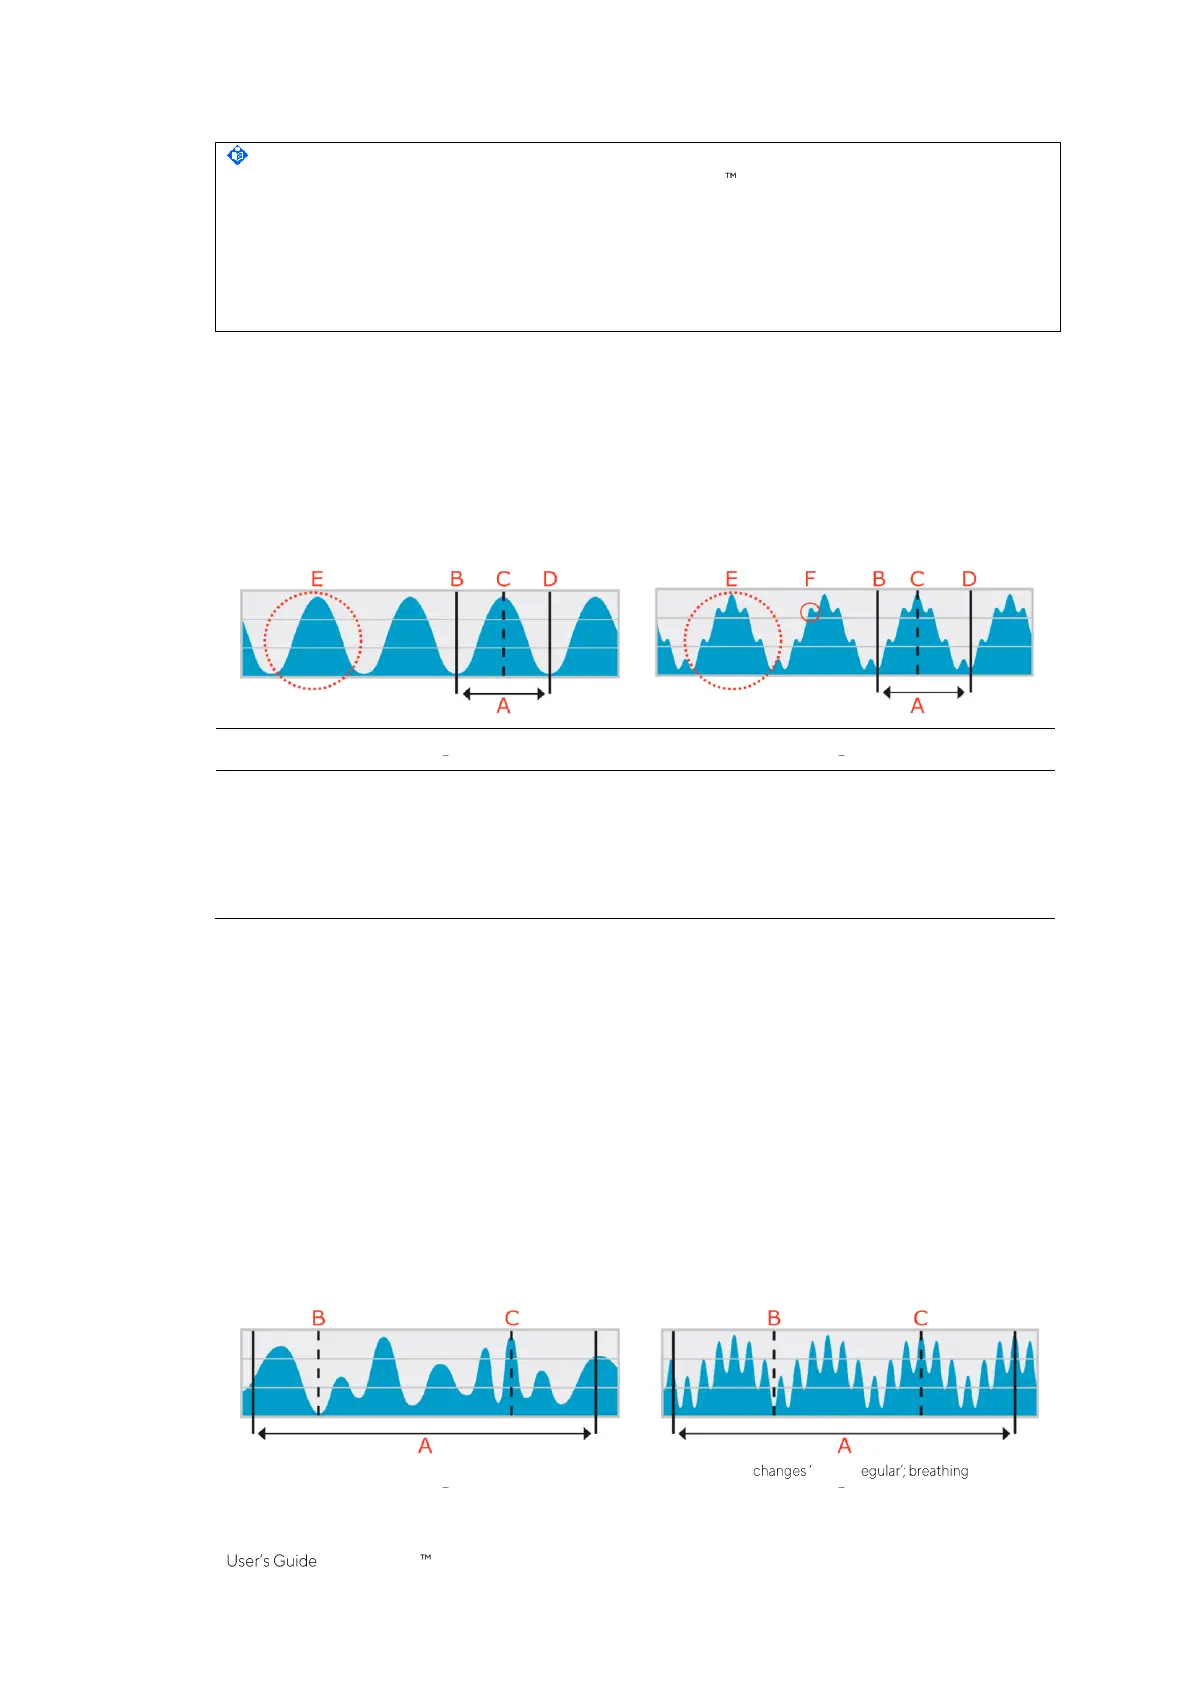
Figure 9-10: Markers on the Plethysmogram in TB-I mode
Lung Impedance
changes irregular and breathing-related;
cardiac-related changes not visible see example (c) of Table 8-1
Lung Impedance
weak & r - and
cardiac-related changes visible see example (d) of Table 8-1
 Loading...