• and then by normalizing for each
Lung Pixel
the corresponding impedance change with the
maximum
Lung Pixel
impedance change.
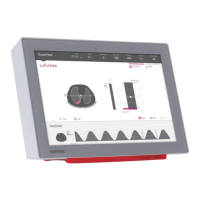
In the example of Figure 9-14 the
BB mode
calculation of the
Stretch Image
is shown, i.e. the last detected
breath is taken as the current
Analysis Interval
and the preceding EELI distribution is subtracted from the
associated EILI distribution.
The
Lung Pixel
values of the resulting
Stretch Image
, i.e.
Lung Pixel
impedance change due to tidal ventilation
normalized to maximum
Lung Pixel
impedance change, are referred to as
Relative Tidal Stretch
(RTS). The
Stretch Image
, hence, displays the regional distribution of
Relative Tidal Stretch
within the
Lung ROI.
Figure 9-14: Illustration of the concept of the Stretch Image. The calculation is explained in the text.
In BB mode, a
Stretch Image
is determined for each detected breath and is related to the regional distribution
of the tidal volume inhaled during this breath within the lungs.
In TB-I mode, a
Stretch Image
is determined every 15 seconds and is related to the regional distribution of the
largest lung volume change as a proxy of the regional distribution of (inhaled or exhaled) tidal volume during
intervals of 15 seconds. Be aware that in
TB-I mode Stretch Images
are calculated even if the maximal
Lung
Impedance
changes detected within intervals of 15 seconds are not breathing-related. If this is the case,
Stretch
Images
may not always be physiologically meaningful. Also be aware that
Stretch Images
obtained with
BB
mode
may differ from those obtained with
TB-I mode.
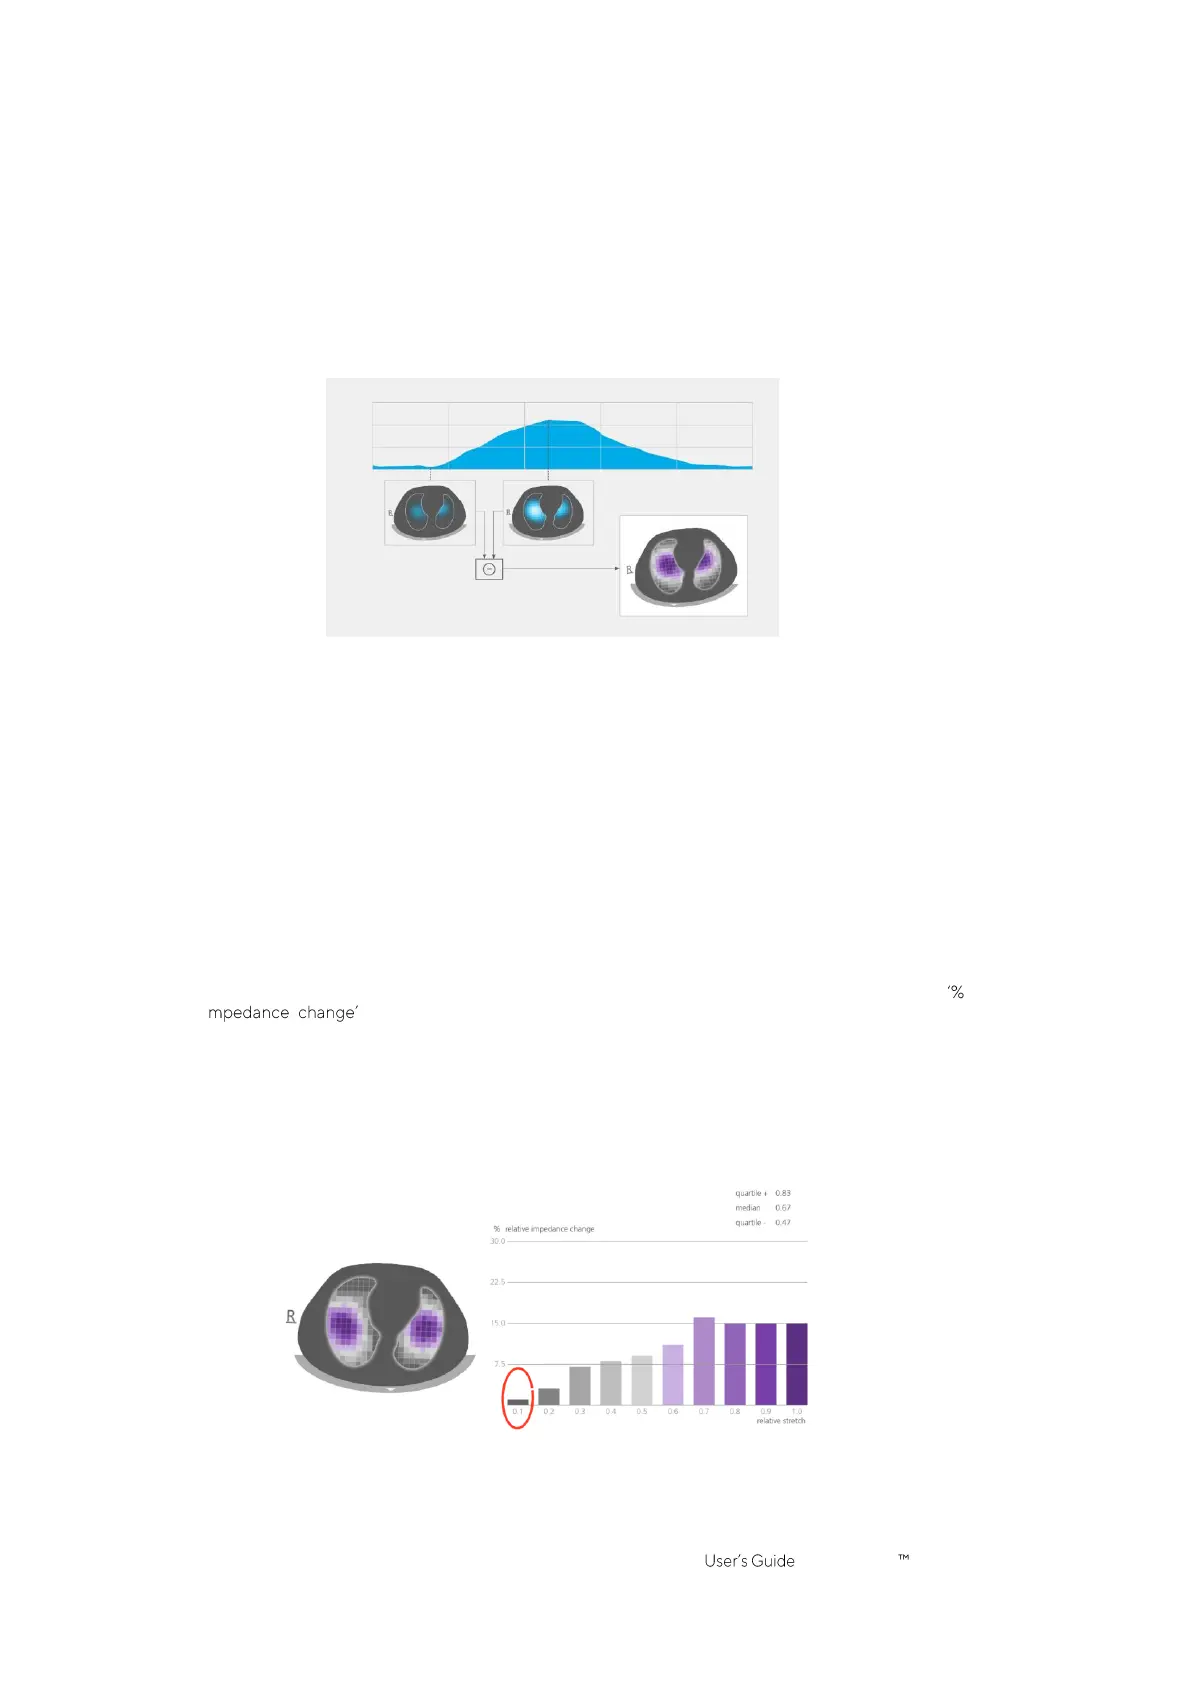
The
Stretch Image
(Figure 9-15) has
Lung Pixel
values between 0 and 100% being subdivided into ten 10%-
wide clusters with similar
Relative Tidal Stretch
. Clusters with large
Relative Tidal Stretch
values, reflecting
better ventilation, are shown in violet colors, and those with small
Relative Tidal Stretch
are displayed in greyish
colors. To visualize how much each cluster contributes to the
Lung Impedance
change between the end-
inspiratory and end-expiratory time points, the associated weighted
Relative Tidal Stretch
histogram is
displayed as a ten-part bar chart on the right of the
Stretch Image
. Each bar represents a cluster of
Lung Pixels
with similar
Relative Tidal Stretch
, whereby the first bar shows those
Lung Pixels
with
Relative Tidal Stretch
values between 0% and 10% and the last bar those between 90% and 100%. The height of each bar is the
relative i or, in other words, the percent contribution of a cluster to the total
Lung
Impedance
change caused by tidal ventilation. The
Lung Pixels
belonging to the first bar, in Figure 9-15
highlighted with an oval, constitute the so-called
Silent Spaces
, representing those regions within the lung that
exhibit little or no impedance change. The rest of the
Lung Pixels
constitute the so-called
Functional Lung
Spaces
(FLS), related to the concept of Functional Lung Size
[1]. The 25% quartile, median and 75% quartile of
weighted
Relative Tidal Stretch
displayed above the ten-part bar chart provide summary statistical information
about both the center and the spread of weighted
Relative Tidal Stretch
.
Figure 9-15: Example of a Stretch Image and of the associated weighted Relative Tidal Stretch histogram.
 Loading...