Operating the software
5.4 The tabs of the RF620R/RF630R readers
SIMATIC RF-DIAG
50 Operating Manual, 09/2012, C79000-G8976-C292-01
Display of the RSSI values
The RSSI values of the transponders are shown in three representations:
● RSSI value according to transponders (a)
The bar diagram shows the RSSI values of the identified transponders in chronological
order. The Y axis shows the RSSI values of the transponder that were read. The X axis
shows the read access to the various transponders. With each read access, the RSSI
values of all identified transponders are represented as a bar.
The transponders are assigned the same colors as in the table above. If a transponder is
selected in the table, the transponder in the bar diagram also changes to the selection
color.
If no transponder is identified during the read, a bar with RSSI value "0" (no bar) is
displayed.
With this representation, you can recognize quickly and simply when a transponder is not
read with every access.
● Current RSSI value (b, c)
The last measured RSSI value is shown in a further bar. With the aid of this view, you can
quickly find the ideal alignment for the highest RSSI value by varying the antenna
position.
The current RSSI value of the selected transponder is also displayed as a numeric value.
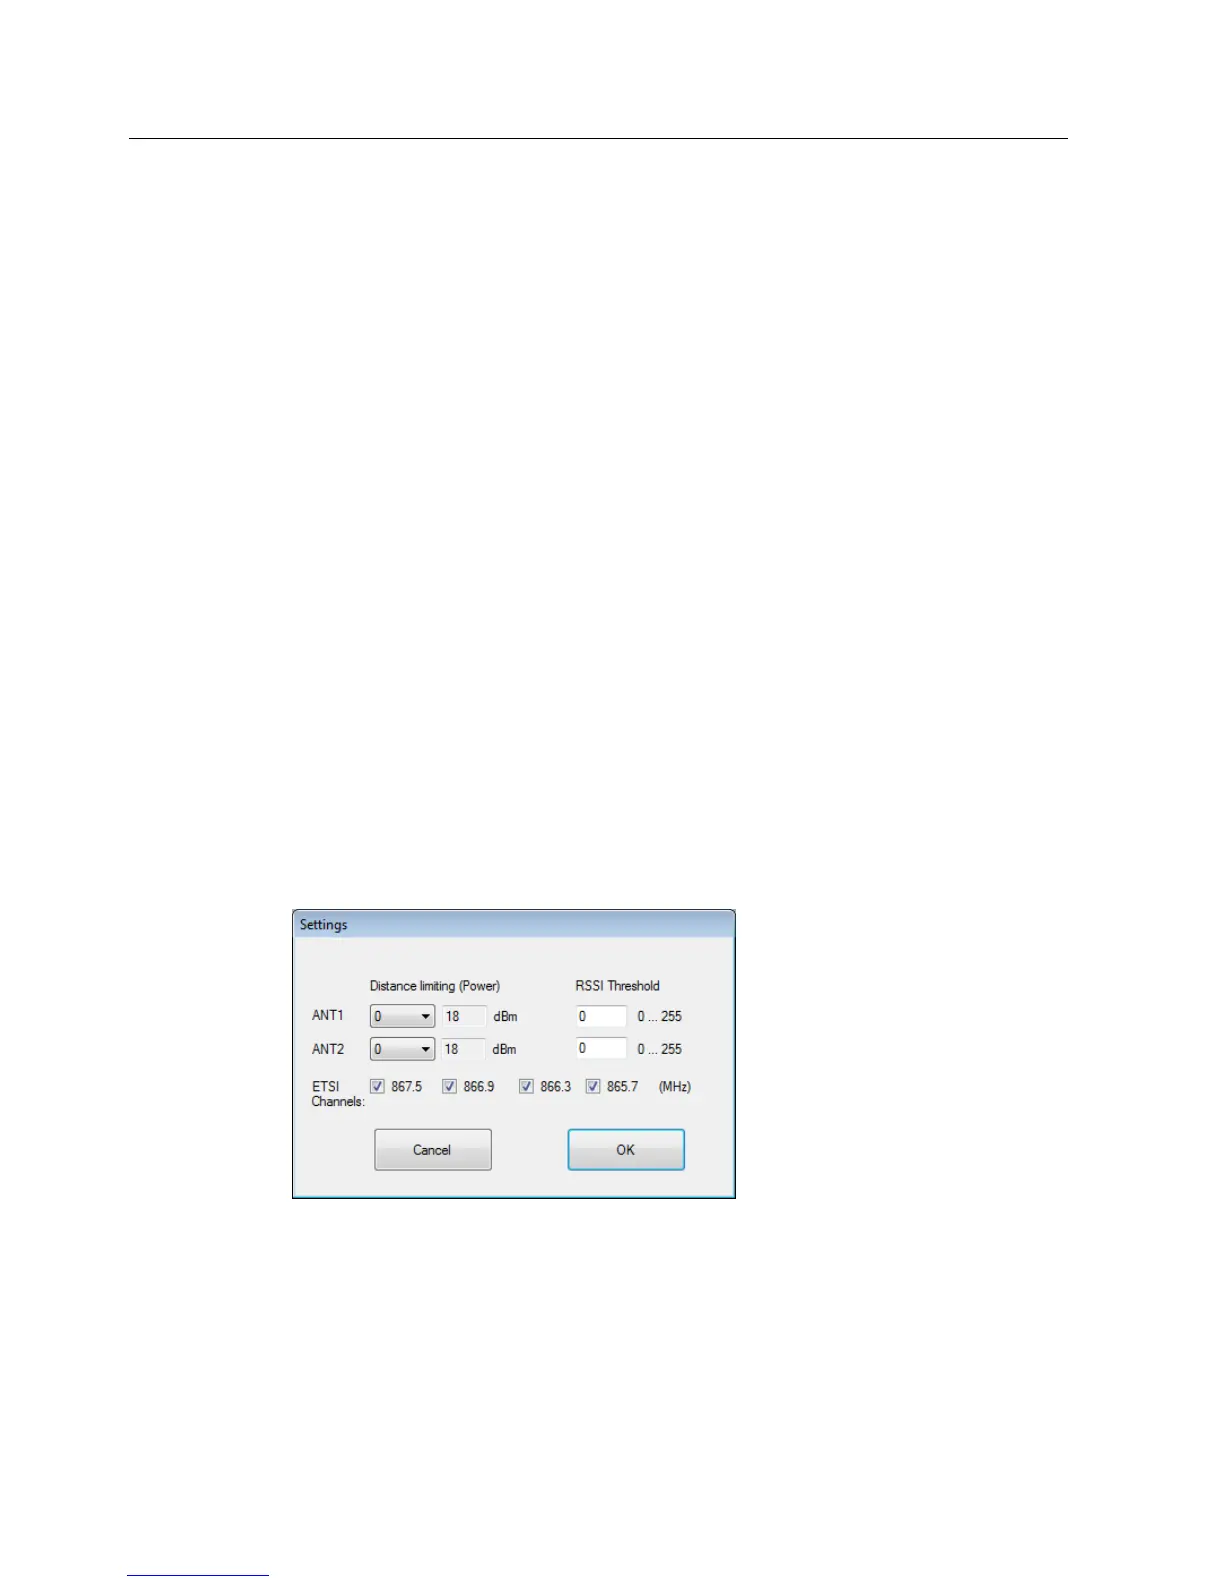
Setting reader parameters
With the "Adjust" button, you can change the most important reader parameters, such as
antenna power or RSSI Threshold. With readers for the ETSI radio profile, you can also
specify the ETSI channels that the reader will use in this dialog box.
Figure 5-9 Changing reader parameters in the "RSSI" tab
The changed parameters are only valid when the program is running. In other words, the
parameters are not stored permanently on the reader. In the "Parameter" tab, you can save
the parameter configurations retentively.