Scanner Viewing and Saving Data
25
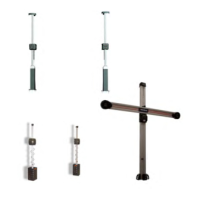
4.5.6 Changing Data Views - PID List / Graphs
Selecting the View icon (Figure 4-22) opens a drop-down menu of
viewing options:
• PID List
• 1 Graph
• 2 Graphs
• 4 Graphs
The PID List view is a 2-column display with the name of the parameters in the left
column and their current values in the right column (Figure 4-22).
Figure 4-22 PID List view
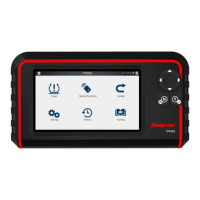
The 1, 2, and 4 Graph views divide the screen horizontally to simultaneously display
data graphs for the indicated number of parameters (Figure 4-23).
Figure 4-23 Four graph view
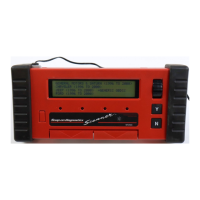
In graph view the text block (Figure 4-24) to the left of the graph displays:
• Top - PID description
• Middle - Current value or state
• Bottom - Active minimum and maximum values
Figure 4-24