82
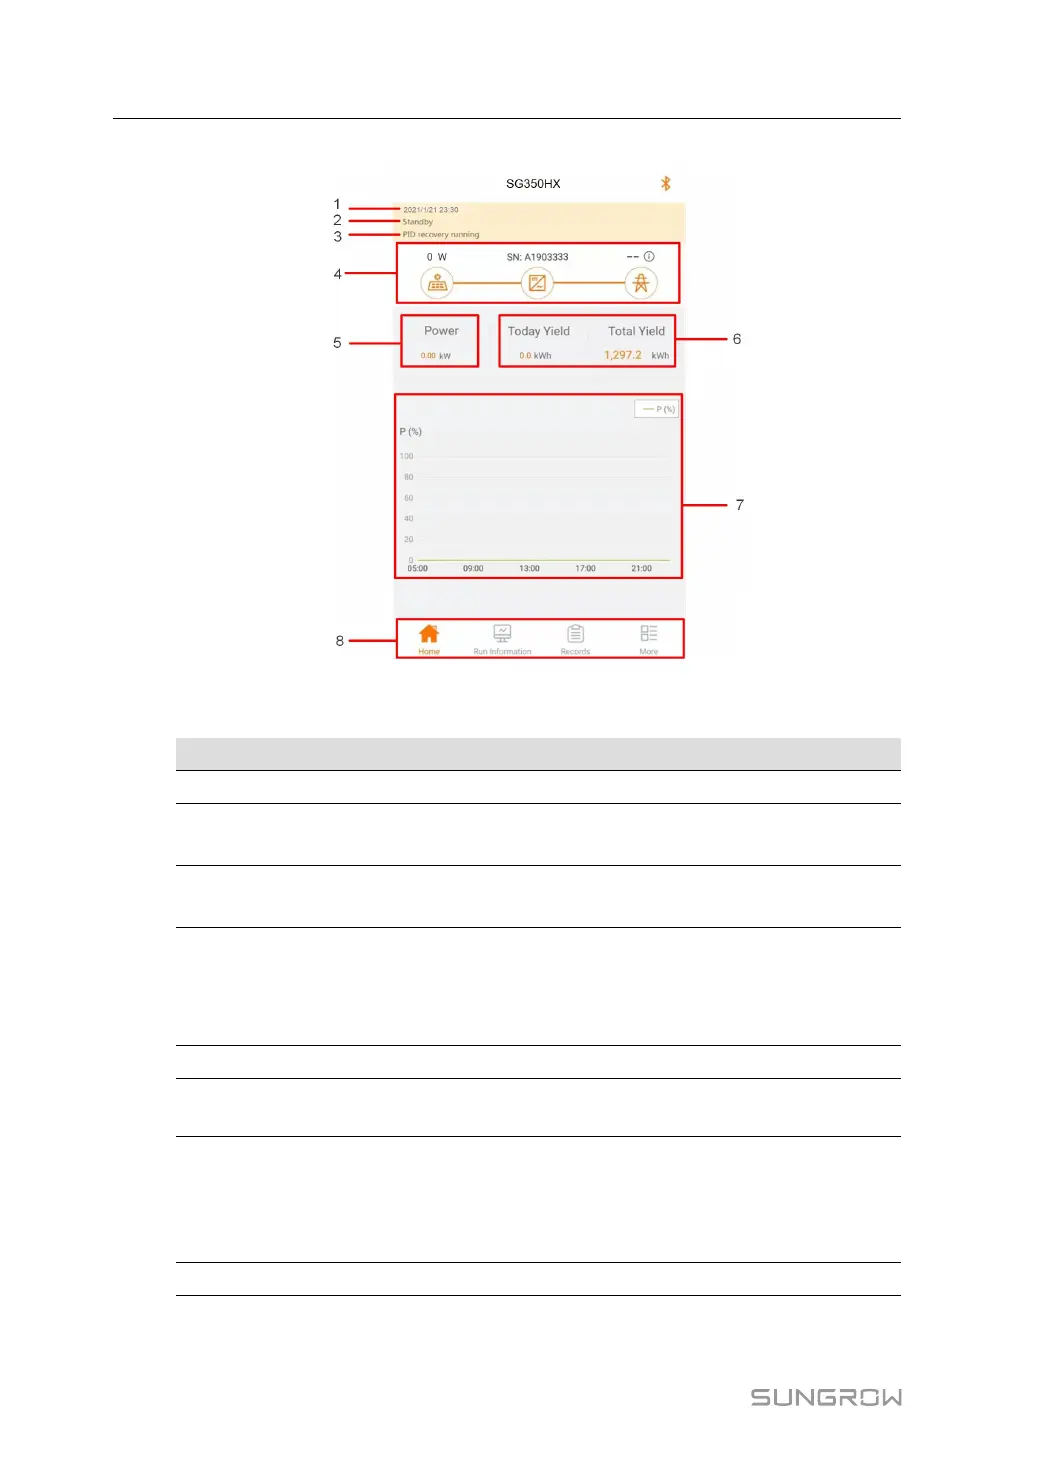
figure 7-5 Home page
table 7-1 Home Page Description
No.
Designation Description
1 Date and time
System date and time of the inverter
2 Inverter state
Present operation state of the inverter For details, refer to
"table 7-2 Description of Inverter State".
3 PID function state
Present state of the PID function For details, refer to "table
7-3 Description of PID Function State"
4 Power flow chart
Display the PV power generation power, feed-in power, etc.
The line with an arrow indicates energy flow between con-
nected devices, and the arrow pointing indicates energy
flow direction.
5
Real-time power Output power of the inverter
6
Power generation
Today power yield and accumulative power yield of the
inverter
7 Power curve
Curve showing change of power between 5 am and 23 pm
every day
(Each point on the curve represents the percentage of
present inverter power to rated power)
8
Navigation bar Including Home, Run-info, His-record, and More
7 iSolarCloud App User Manual