86
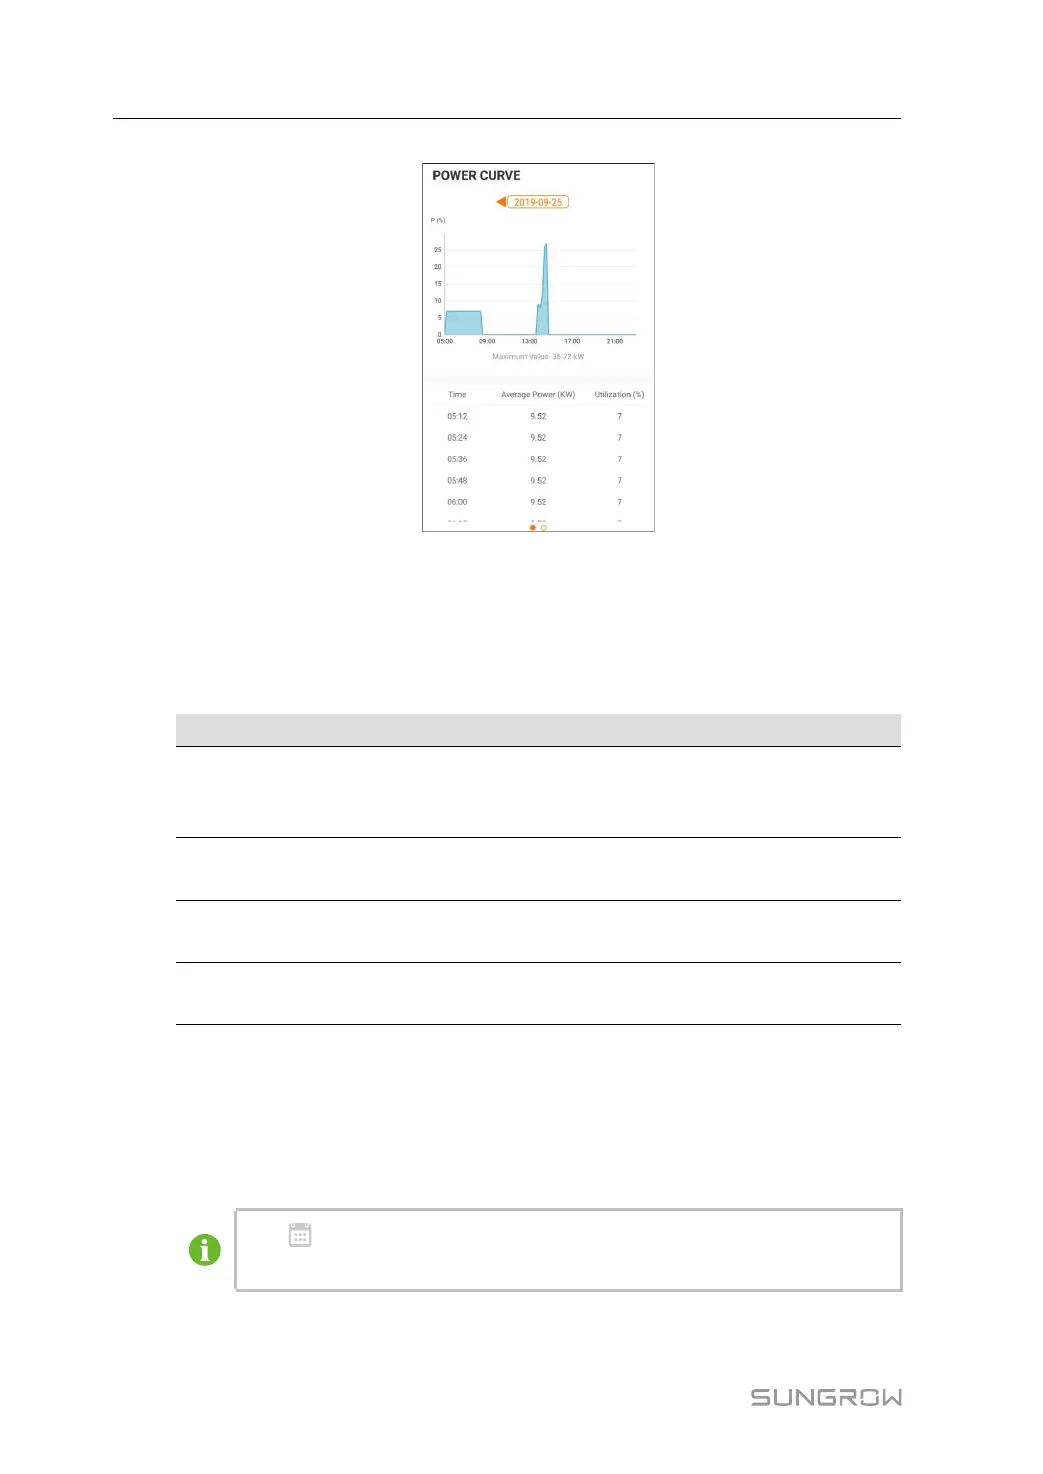
figure 7-9 Power Curve
The App displays power generation records in a variety of forms, including daily power gen-
eration graph, monthly power generation histogram, annual power generation histogram
and total power generation histogram.
table 7-5 Explanation of power yields records
Parameter
Description
Power curve
Show the power output from 5 am to 11 pm in a single day. Each
point in the curve is the percentage of present power and nominal
power.
Daily energy
histogram
Shows the power output every day in the present month.
Monthly energy
histogram
Shows the power output every month in a year.
Annual energy
histogram
Shows the power output every year.
Tap the time baron the top of the screen to select a time segment and view the correspond-
ing power curve.
Swipe left to check the power yields histogram.
Event Record
Tap Event Recordto view event record list.
Click
to select a time segment and view corresponding records.
The inverter can at most record the latest 400 events.
7 iSolarCloud App User Manual
 Loading...