65
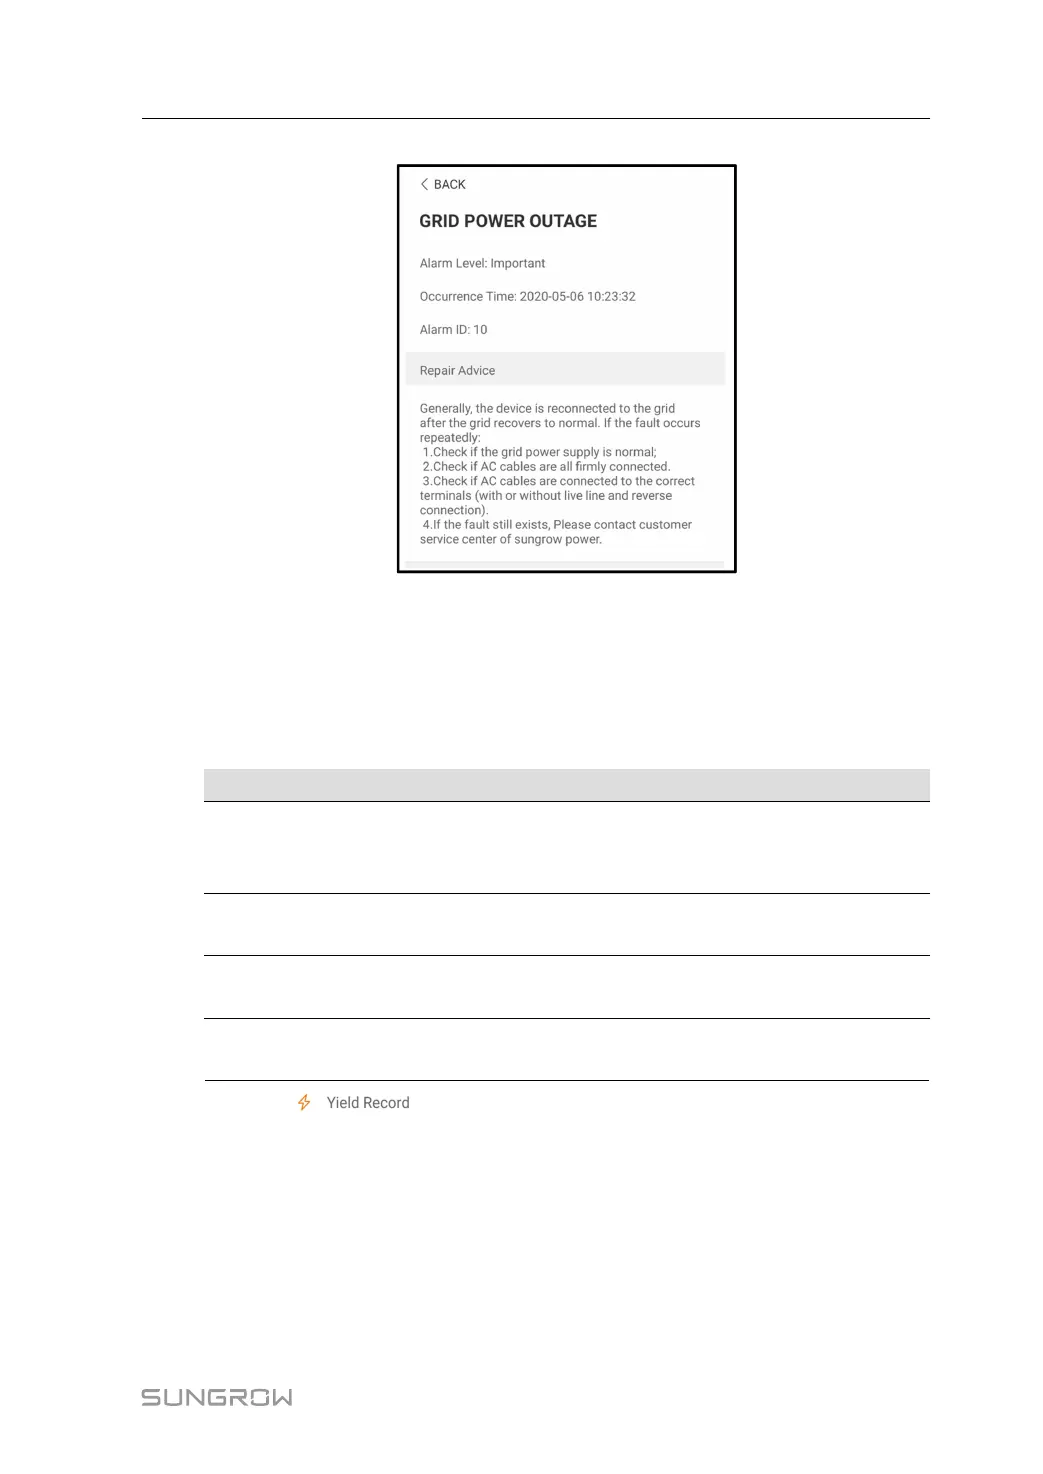
FFiigguurree 77--99 Detailed fault and alarm information
7.7.2 Yields Records
User can view various energy records: power curve, daily energy histogram, monthly
energy histogram, and annual energy histogram.
Table 7-5 Explanation of power yields records
PPaarraammeetteerr
DDeessccrriippttiioonn
Power curve
Show the power output from 5 am to 11 pm in a single day.
Each point in the curve is the percentage of present power and
nominal power.
Daily energy
histogram
Shows the power output every day in the present month.
Monthly energy
histogram
Shows the power output every month in a year.
Annual energy
histogram
Shows the power output every year.
Click the “
” to view the power curve page as shown in following Figure.
User Manual 7 iSolarCloud App
 Loading...