8. Using an FFT toAnalyze a
Signal’s Frequency Spectrum (2/2)
The FFT function calculates the frequency input of the
source waveform. Cursors make it easy to measure
frequency and amplitude in the spectrum.
8. The default FFT window is Hanning. Use the Window
bezel button and MPK to switch to the Rectangular
window and note the result.
9. Press the Horizontal Scale bezel button and use the
MPK to adjust the horizontal scale to 1.56 kHz/div.
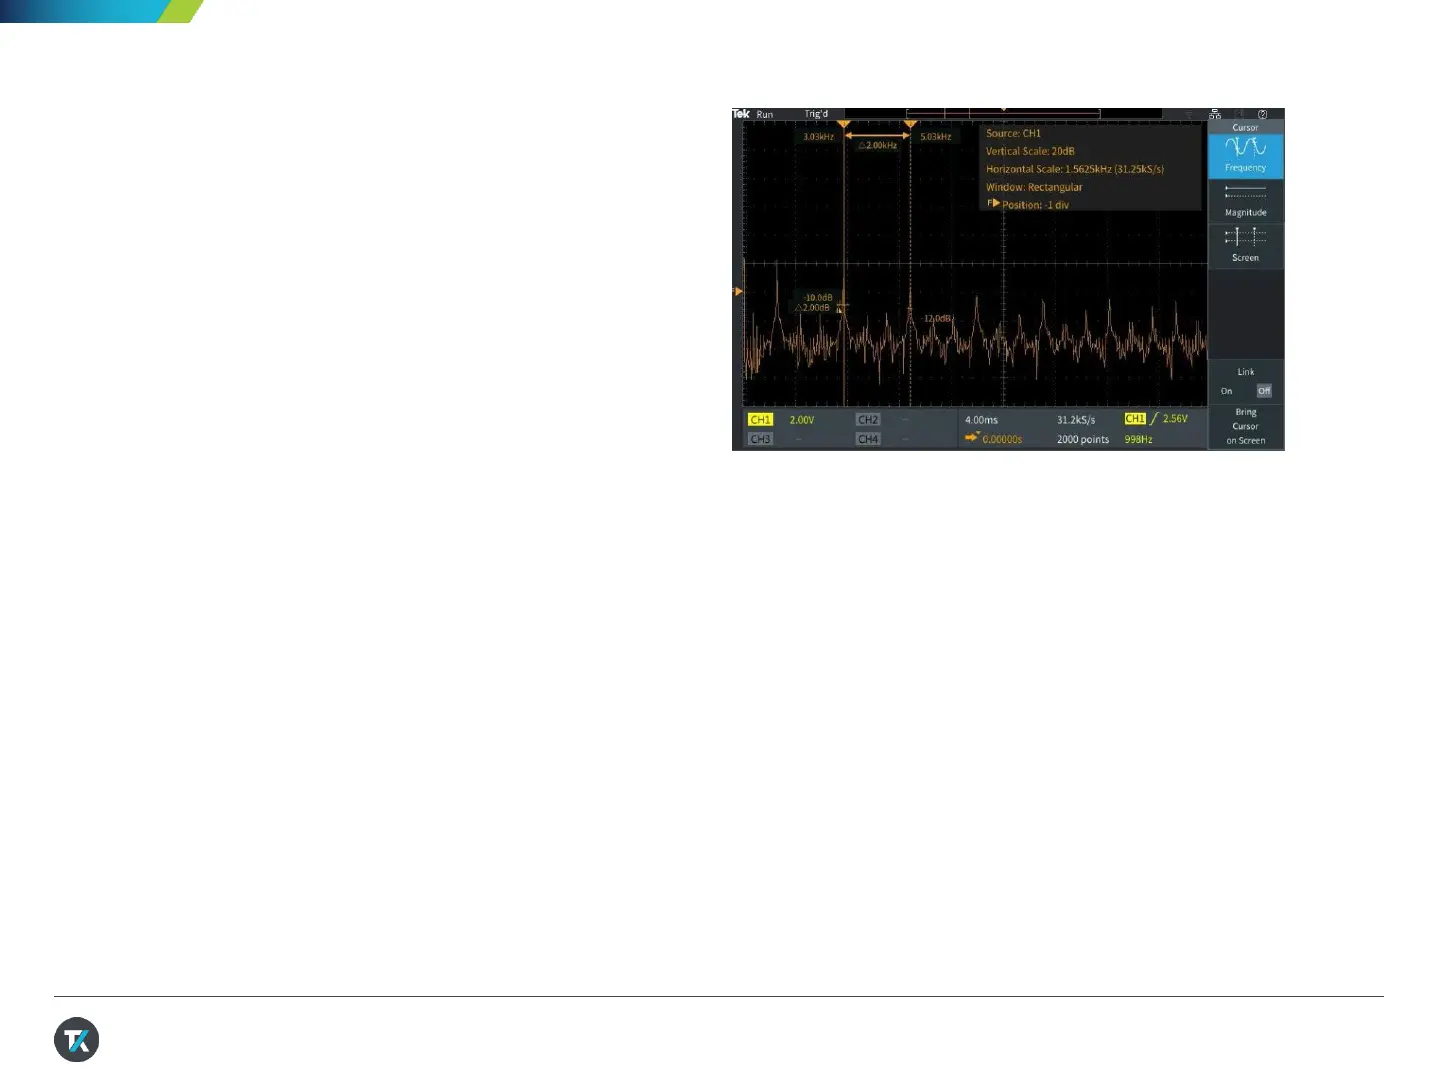
10. Press the Cursor button and position the cursors on
the third and fifth harmonic frequencies (Figure 15).
11. The delta between third harmonic and fifth harmonic
frequency should be 2 kHz, which is consistent with
the 1 kHz fundamental frequency of the Probe Comp
output.
Figure 15. Cursors positionedon the 3 kHz and 5 kHz
harmonicsof the 1 kHz probe comp output .
21
 Loading...