101
Sidekick
®
Plus Test Set
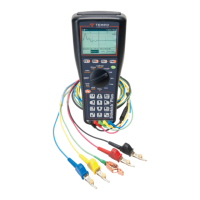
Bits per Tone
The Bits graph shows the actual number of bits that
are carried over each separate channel (frequency). The
graph can indicate issues with noise, bridge taps, or
attenuation. The horizontal axis is the bin index, and the
vertical axis is bits.
Press up (2) to advance to the SNR graph.
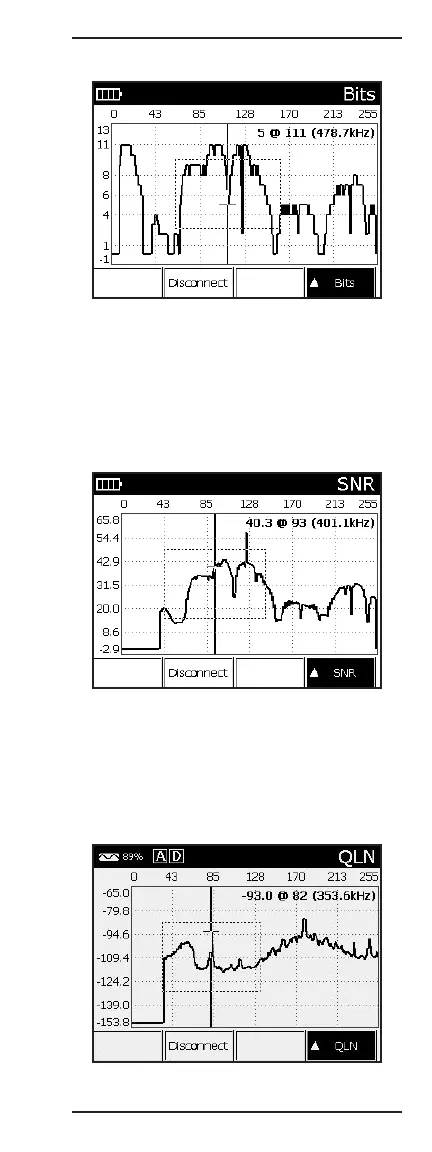
SNR per Tone
The SNR graph shows the signal-to-noise ratio of each
channel (frequency). It can indicate typical noise issues
with the line such as cross talk. The horizontal axis is
the bin index, and the vertical axis is SNR in dB.
Press up (2) to advance to PPP authentication.
QLN