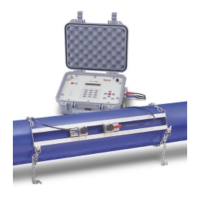
3. Use Cursor
→→
and Cursor
←←
to position the
left cursor line to the desired wavelength value.
The instrument calculates the 3-point net
absorbance for the selected wavelengths.
4. Continue selecting the other wavelengths by
pressing Next Cursor to activate the center
and right cursor lines. Select the wavelengths
by positioning the cursor with the Cursor
←←
and Cursor
→→
keys. Repeat until all three
wavelengths have been selected.
5. Press Enter Factor to access the set factor
box. Enter the desired factor and press
ENTER. The instrument calculates the value
for the 3-point net absorbance for the selected
wavelengths, multiplied by the selected factor.
Calculating the area under a curve
1. With your scan data displayed on the Edit
Graph screen, press Math. The Math
Calculation screen appears.
2. Press Area. The Area Under the Curve
Measurement screen appears.
3. Use Cursor
→→
and Cursor
←←
to position the
left cursor line to the desired wavelength value.
The instrument calculates the area under the
curve for the selected wavelengths.
4. Continue selecting the other wavelengths by
pressing Next Cursor to activate the next
cursor line. Select the wavelength by
positioning the cursor with the Cursor
→→
and
Cursor
←←
keys.
5. Press Set Options to access the set options
window.
6. Use the up and down arrows to highlight
Factor. Enter the desired factor and press
ENTER.
7. Use the up and down arrow to highlight
Calculation baseline. Press ENTER to toggle
between Zero and Tangent.
8. Press ESC to return to the area under a curve
screen. The instrument calculates the area
under a curve for the selected wavelengths,
factor and calculation method.
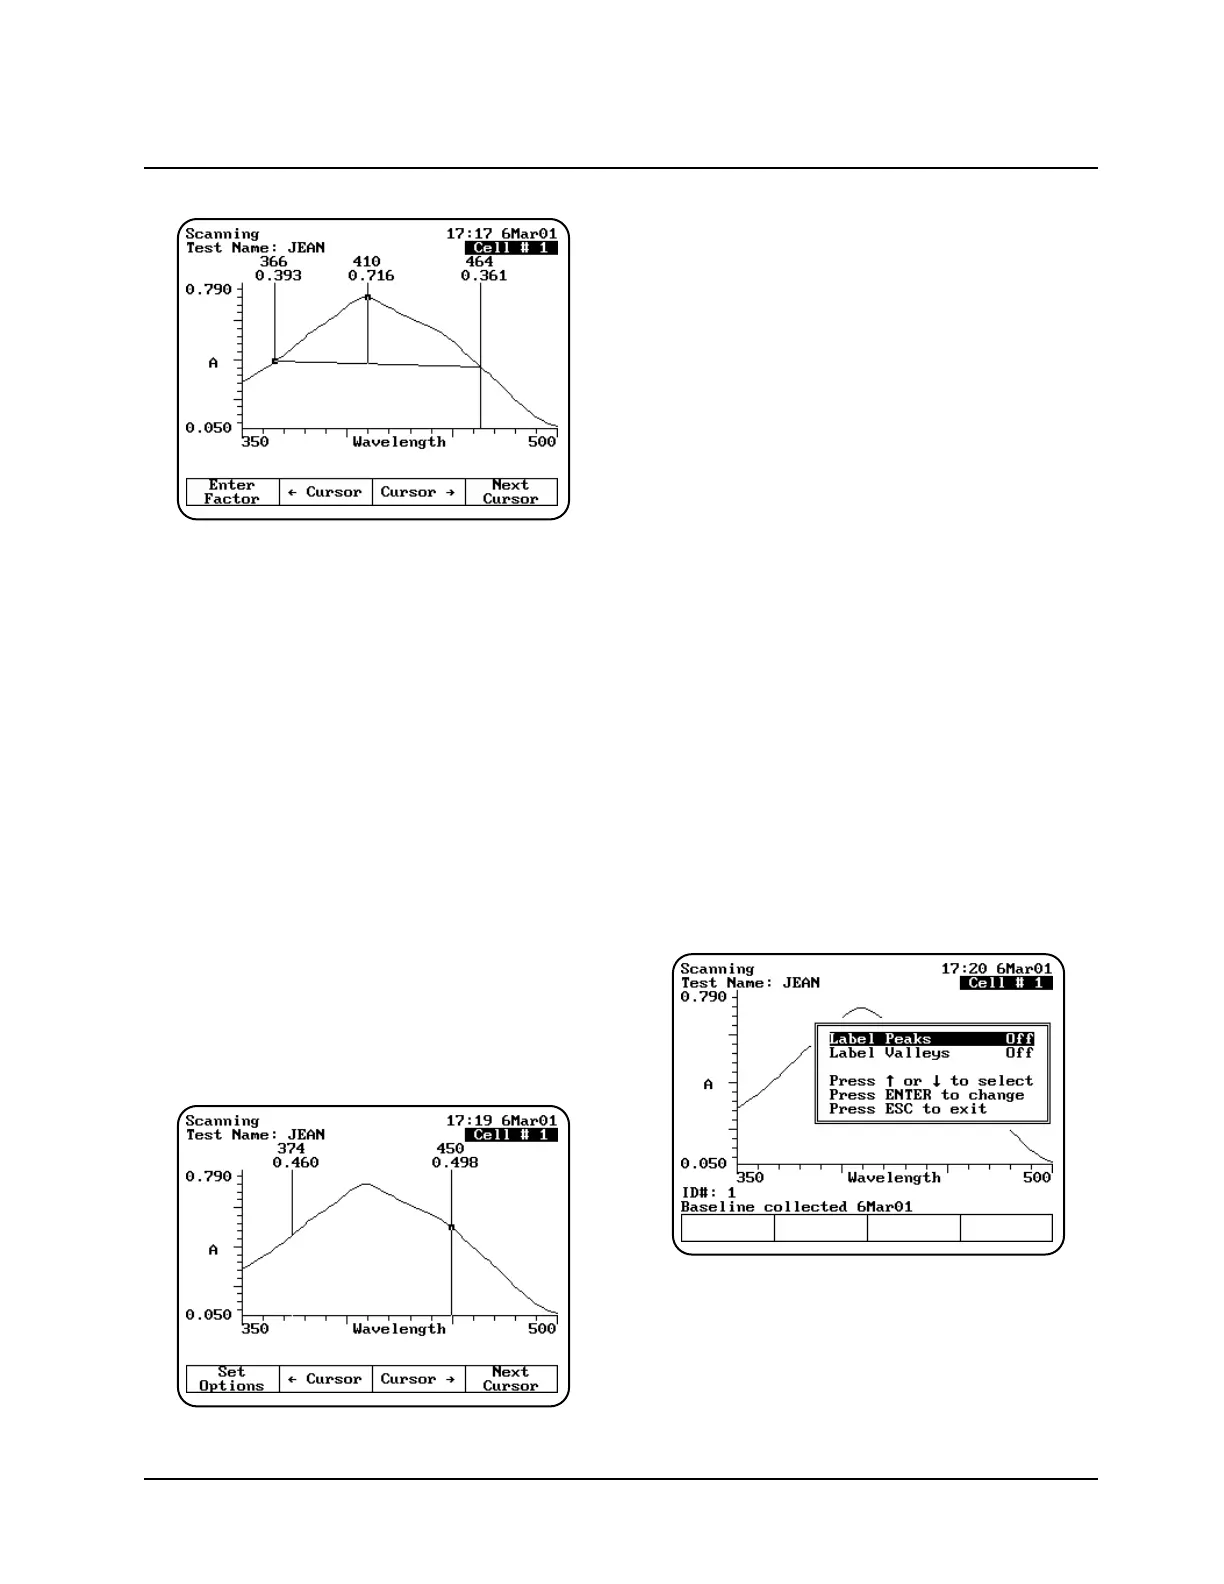
Labeling peaks and valleys
1. With your scan displayed on the edit graph
screen, press Math. The Math Calculation
screen appears.
2. Press Peaks & Valleys. The Label Peaks and
Valleys window appears.
3. Use the arrow keys to select the type of labels
you want displayed and press ENTER. The
instrument labels the selected items on your
scan data plot.
Using “General Tests” Software
3-23 BioMate 3 Operator’s Manual
 Loading...