7.3. Entering laboratory results
When you have determined the total solids content of
the sample in the laboratory, press ESC in the main
menu to access the Operations menu, and then select
"Calibration" -› "Enter Lab". The following display will
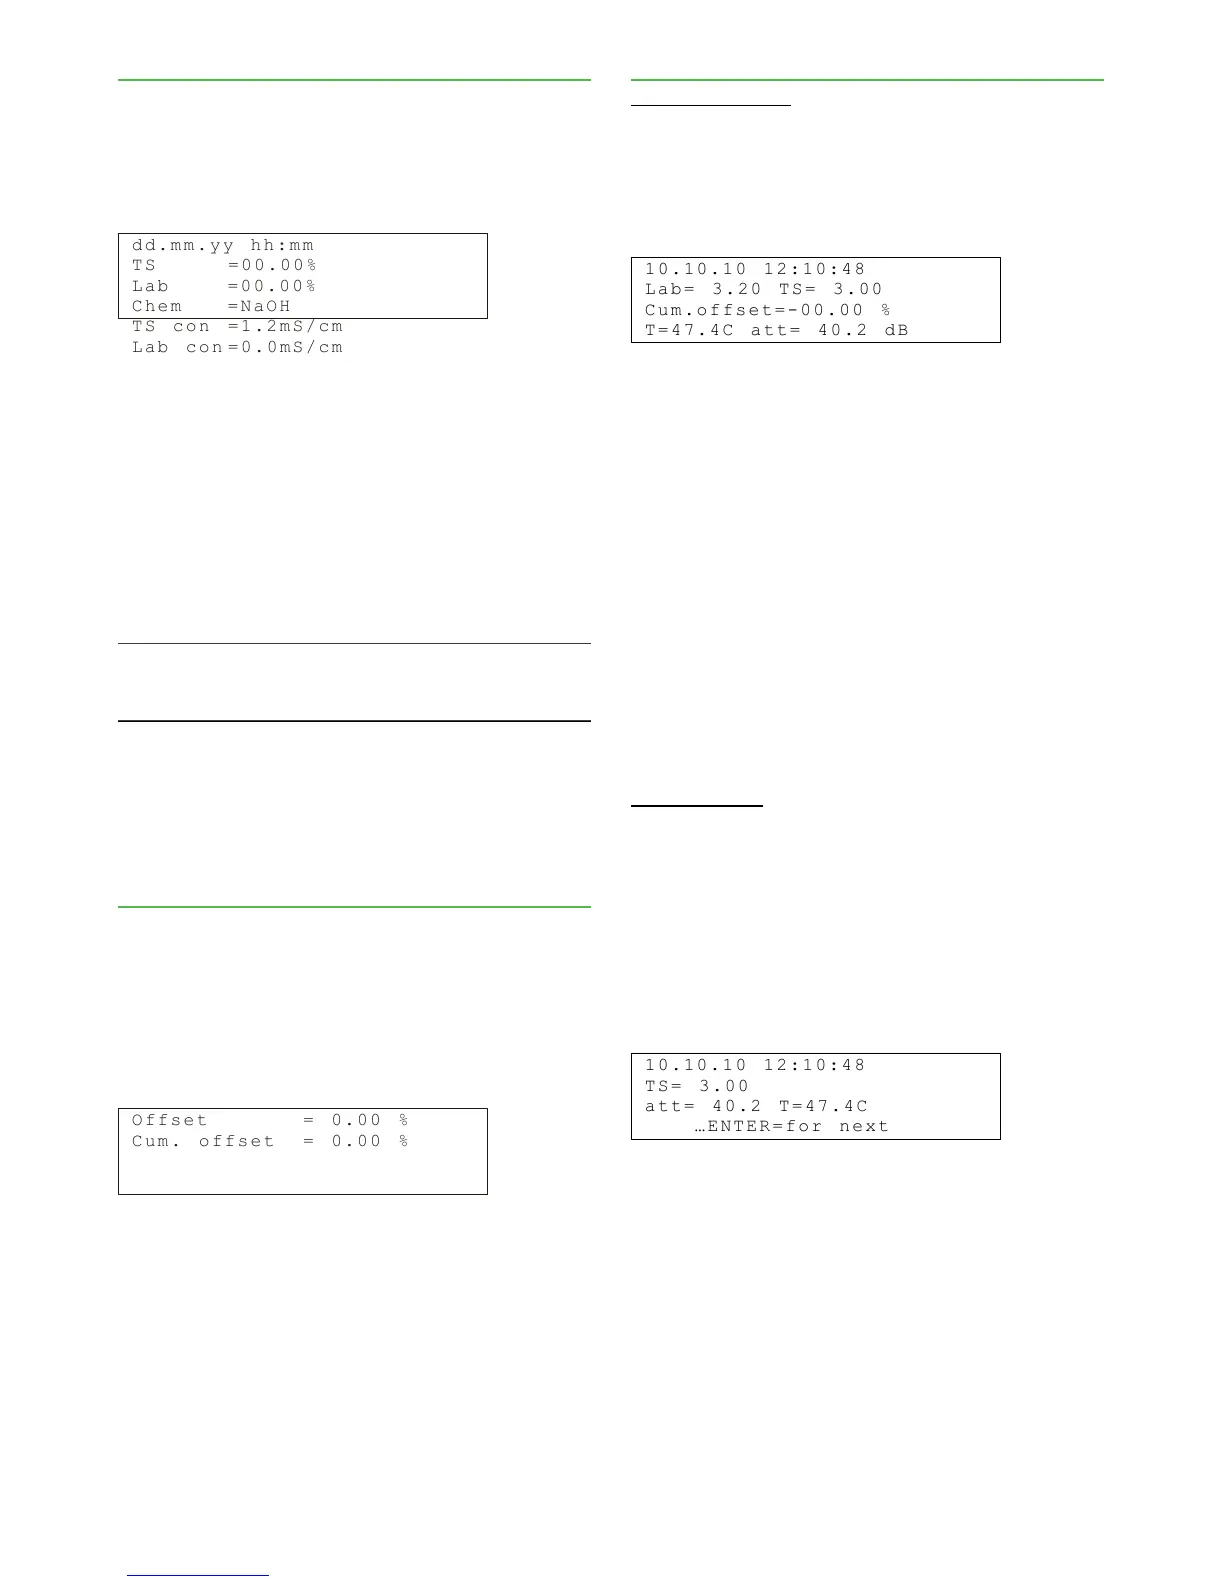
appear:
d d . m m . y y hh : m m
T S = 0 0 . 0 0 %
L a b = 0 0 . 0 0 %
C h e m = N a O H
T S c o n = 1 . 2 m S / cm
L a b c o n =0 . 0 m S/ c m
The first line shows the sampling date and time in
the format dd.mm.yy, hh:mm. The second line shows
the total solids content measured by Valmet TS. Press
"Edit/Save", and the cursor will appear in the field "Lab".
Enter here the total solids content result obtained in
the laboratory.
When calibrating the conductivity measurement,
enter the laboratory result for conductivity in the field
"Lab con", use mS/cm as the unit.
Press "Edit/Save" to save the values.
NOTE: The lines "Chem", "TS con" and "Lab con" are
only needed for chemical compensation (see section
9.1).
The laboratory value of the sample can only be
entered once in the "Enter Lab" menu. If necessary,
you can perform offset correction for the total solids
content calibration as explained below ("Offset correc-
tion").
7.4. Offset correction
If laboratory monitoring indicates that the Valmet TS
measurement results are consistently too high or low,
this can be corrected by offset correction of the calibra-
tion.
Press ESC in the main menu to access the Opera-
tions menu, then select "Calibration" -› "Offset correc-
tion". The following display will appear:
O f f s e t = 0 . 0 0 %
C u m . o f f s et = 0. 0 0 %
Press "Edit/Save", and the cursor will appear in the
field "Offset". Enter the required offset correction value
in the field. For example, if the laboratory monitoring
shows that the Valmet TS result is 0.1% too high, the
offset correction should be - 0.1%. Press "Edit/Save"
to save the values.
7.5. Calibration and sample history
Calibration history
The calibration history table contains the last ten
changes made to the total solids content calibration.
To see the table, press ESC in the main menu to ac-
cess the Operations menu, and then select "Calibration"
-› "Calib. history". The following display will appear:
1 0 . 1 0 . 1 0 12 : 1 0: 4 8
L a b = 3 . 2 0 T S= 3 . 0 0
C u m . o f f se t = -0 0 . 00 %
T = 4 7 . 4 C a tt = 4 0 .2 d B
The first line shows the date (dd.mm.yy) and time of
the calibration change. The second line shows the
entered laboratory result (Lab) and the corresponding
Valmet TS measurement result (TS), if the calibration
was made using a new sample. If only an offset correc-
tion was made, the second line shows the laboratory
result (Lab) and the offset change (Offs). The third line
shows the cumulative change resulting from the level
changes.
Here you can see if the calibration has been re-
peatedly corrected in the same direction or back and
forth. The former alternative clearly indicates that the
device measurement has been drifting. In the latter
case, either there is a device error, or the laboratory
analyses and the calibration based on these may be
incorrect.
Sample history
The sample history table contains the 30 latest calibra-
tion and monitoring samples. Monitoring samples can
be taken by pressing "Sample" in the main menu, while
calibration samples must be taken in the "Sample tak-
ing" menu.
You can also use this table if you wish to read the
measured values for certain samples. To access the
sample history table, go to Operations menu and press
"Calibration" -› "Sample history".
1 0 . 1 0 . 1 0 12 : 1 0: 4 8
T S = 3 . 0 0
a t t = 4 0 . 2 T =4 7 . 4C
… E N T E R = fo r n e xt
The first line shows the sample date and time. The
second and third line show the Valmet TS measurement
results for total solids content, measurement signal at-
tenuation, and process temperature.
Installation & Owner's manual, OUL00489 V2.3 EN
24
Valmet Total Solids Transmitter