47
6 Set up the sensor with the display and adjustment module
VEGAPULS 63 • Modbus and Levelmaster protocol
41364-EN-170711
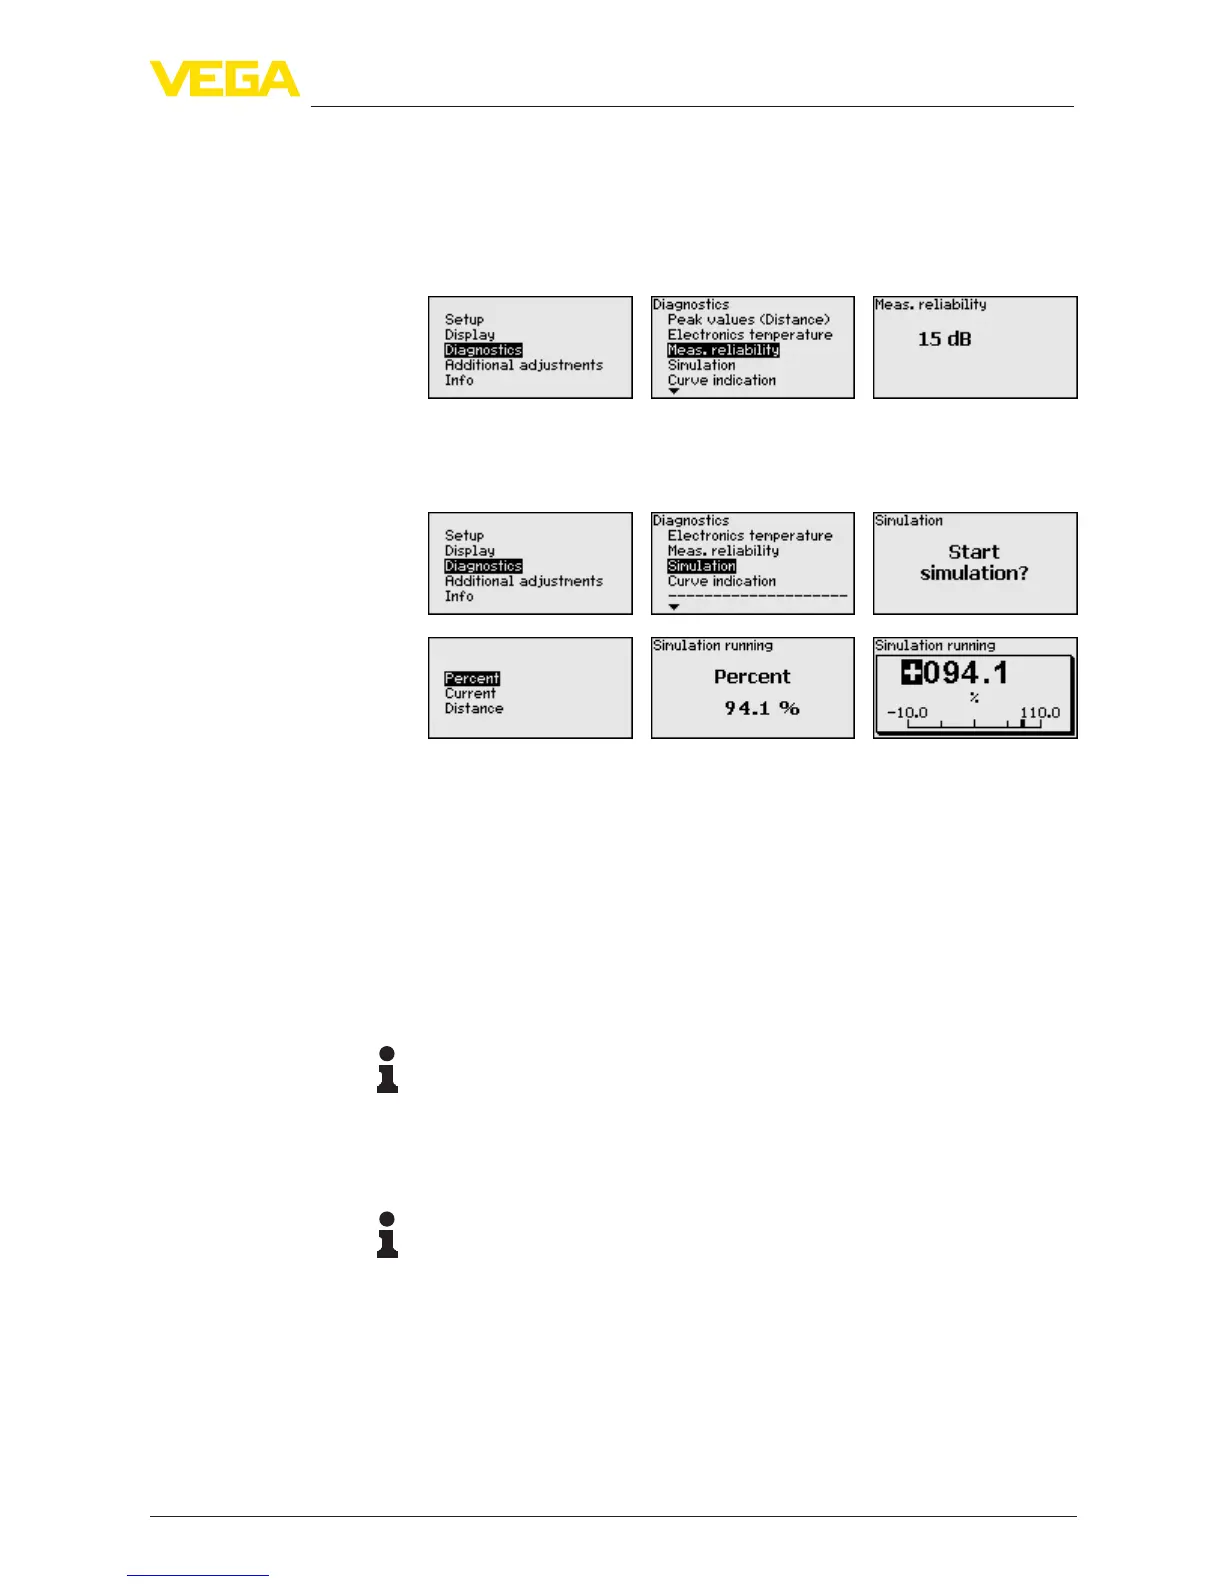
When non-contact level sensors are used, the measurement can be
inuencedbytherespectiveprocessconditions.Inthismenuitem,
the measurement certainty of the level echo is displayed as a dB
value. Measurement reliability equals signal strength minus noise. The
higher the value, the more reliable the measurement. A well function-
ing measurement normally has a value > 10 dB.
In this menu item you can simulate measured values via the current
output. This allows the signal path to be tested, e.g. through down-
stream indicating instruments or the input card of the control system.
How to start the simulation:
1. Push [OK]
2. Select the requested simulation variable with [->]andconrm
with [OK].
3. With [OK]youstartthesimulation,rstofalltheactualmeasured
value is displayed in %
4. Start the editing mode with [OK]
5. Set the requested numerical value with [+] and [->].
6. Push [OK]
Note:
During simulation, the simulated value is outputted as 4 … 20 mA cur-
rent value and digital HART signal.
How to interrupt the simulation:
→
Push [ESC]
Information:
The simulation is automatically terminated 10 minutes after the last
pressing of a key.
The "Echo curve" shows the signal strength of the echoes over the
measuring range in dB. The signal strength enables an evaluation of
the quality of the measurement.
Diagnosis - Measurement
reliability
Diagnosis - Simulation
Diagnosis - Curve indica-
tion






 To Next Page