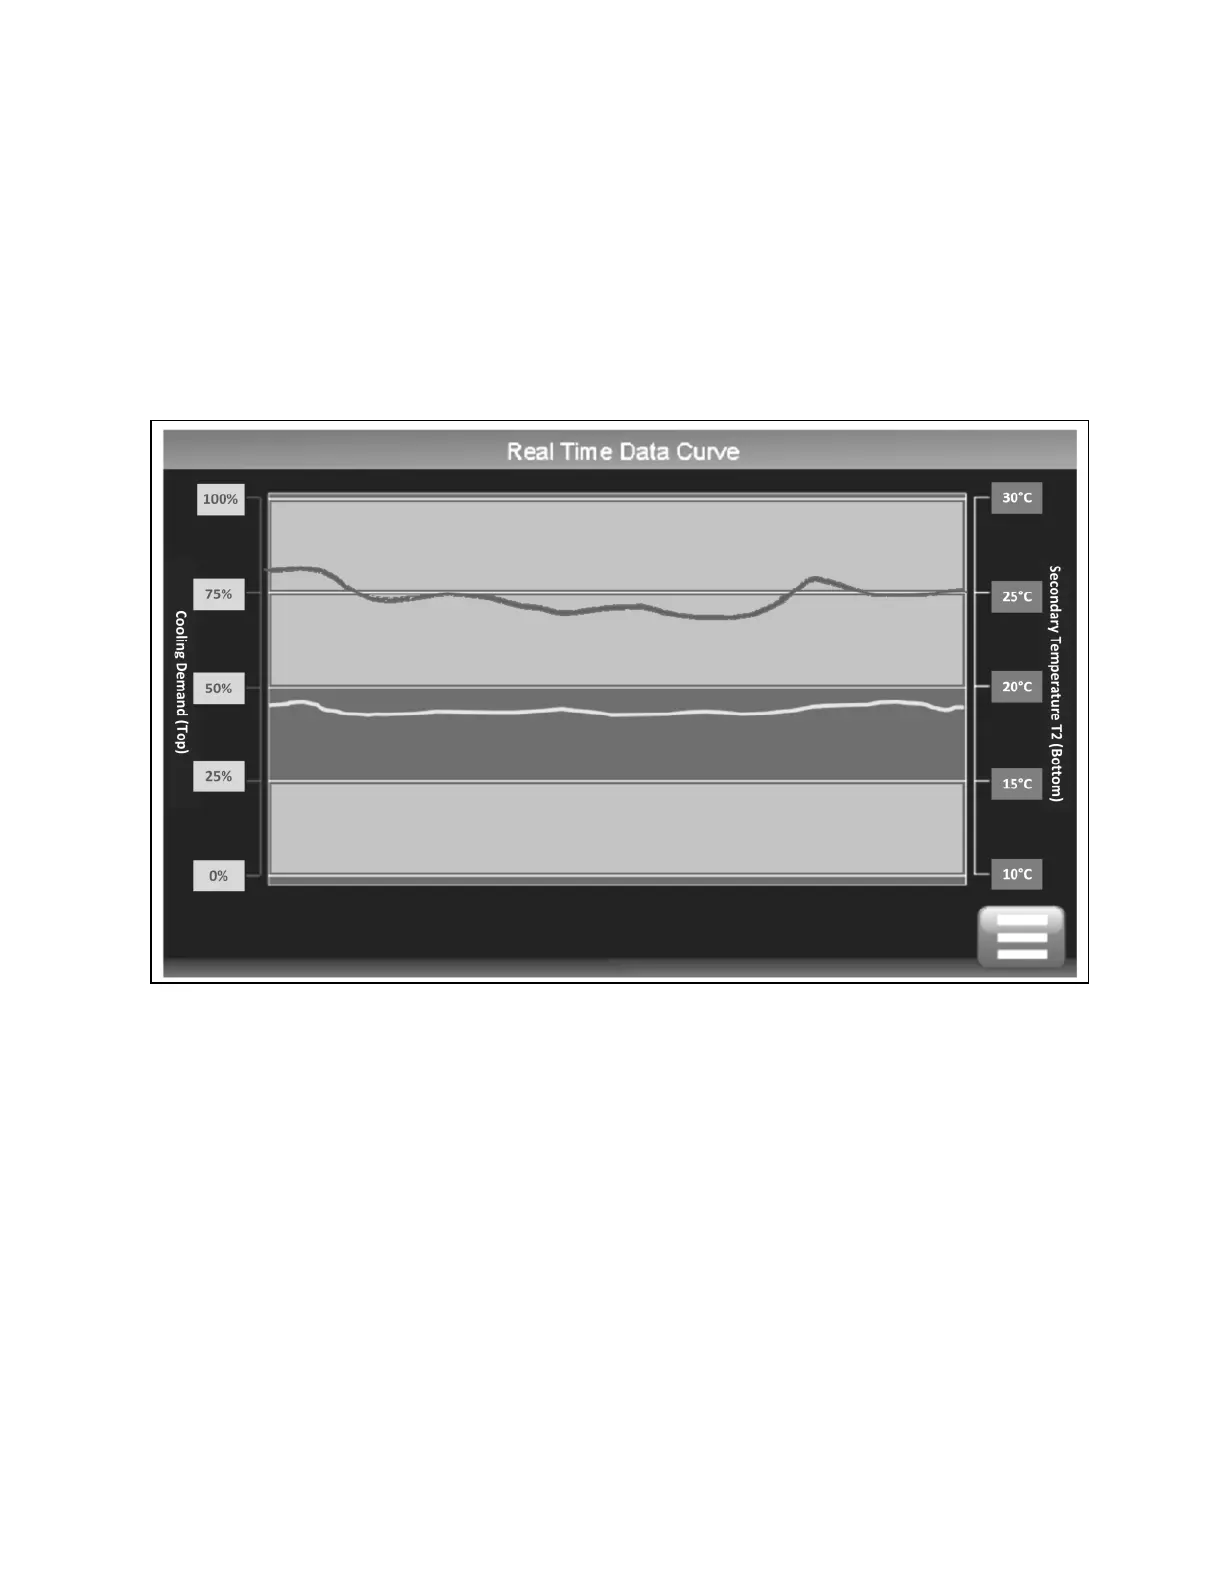
4.2.4 Data Curves Screen (Real Time Update)
The Data Curves screen shows a graphic representation of Cooling (Control Valve) Demand and Secondary Supply
Temperature T2.
• Red traces cooling (Control Valve)
• Yellow traces Secondary Temperature Supply T2
Both update in real time, time span of display is 3 minutes.
Figure 4.4 Control System Data Curves Screen
22 Proprietary and Confidential ©2025 Vertiv Group Corp. 4 Operation
Vertiv™ CoolChip CDU 600 Operation and Maintenance Guide