content area displays recent events, including event codes and status of events. It also displays primary sensor information
and PDUstatus information, including a summary of the receptacle state and capacity utilization percentage.
NOTE: Sensor information is selectable from the Sensor view of the PDUExplorer tab.
3.3.1 Recent events
The Recent Events table displays information about branch, receptacle, sensor, PDU and system level events. You can view
this table when you select a rack PDU.
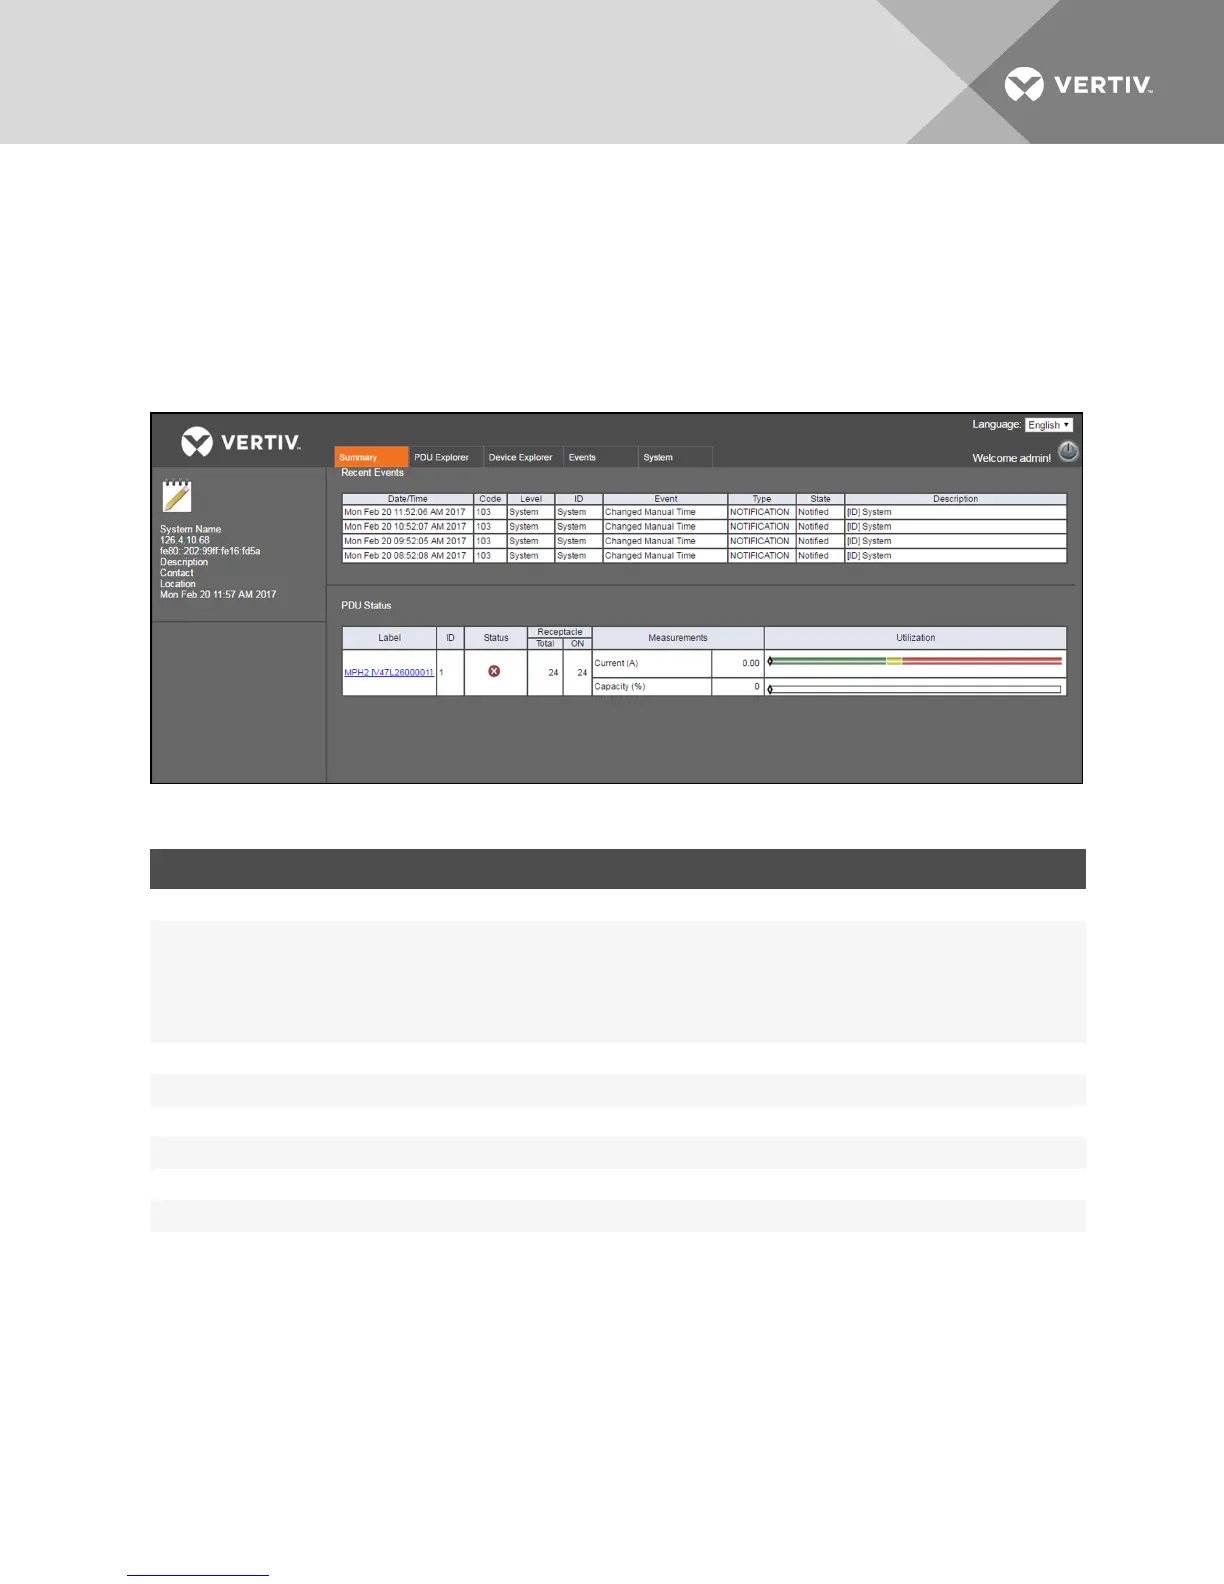
Figure 3.2 Summary Tab Example
HEADING DESCRIPTION
Date/Time Date and time the event occurred
Code
Identifier for the event
100-199:System level events
200-299:PDUlevel events
300-399:Branch level events
400-499:Receptacle level events
500-599:Sensor level events
Level Level where the event occurred:Receptacle, branch or system
ID IDwhere the even occurred
Event Listing of the event
Type Severity type of the event:Notification, warning or alarm
State Whether notification has been sent
Description Information about the event
Table 3.3 Recent Event Descriptions
To view recent events:
Under the PDUSummary tab, click a rack PDUin the Label column.
3.4 PDU Explorer Tab
The PDU Explorer window displays a hierarchical view of data from connected equipment. It also permits viewing sensors
and editing sensor settings. The top of the window displays the Rack PDU view. You can navigate to the PDU, branch and
receptacle levels from either using the link of the connected equipment or the side navigation tree.
Vertiv | RPC2™ Communications Module Installer/User Guide | 11