The no format report has only two tabs. In the rst, “Report” you will have the
general data, graph, map and table with all the samples. You will nd all the
screenshots in the “Screenshots” tab.
Note: Generating graphs can take some time, especially in the case of measurements
with a large number of samples.
8.3.5. Control centre screen
If you have access to a Wavecontrol Control Centre for managing MonitEM
and SMP2 devices, you can upload your SMP2 measurements directly to the
Control Centre.
Note: You can only upload one measurement at a time. You will need an Internet
connection to use this feature.
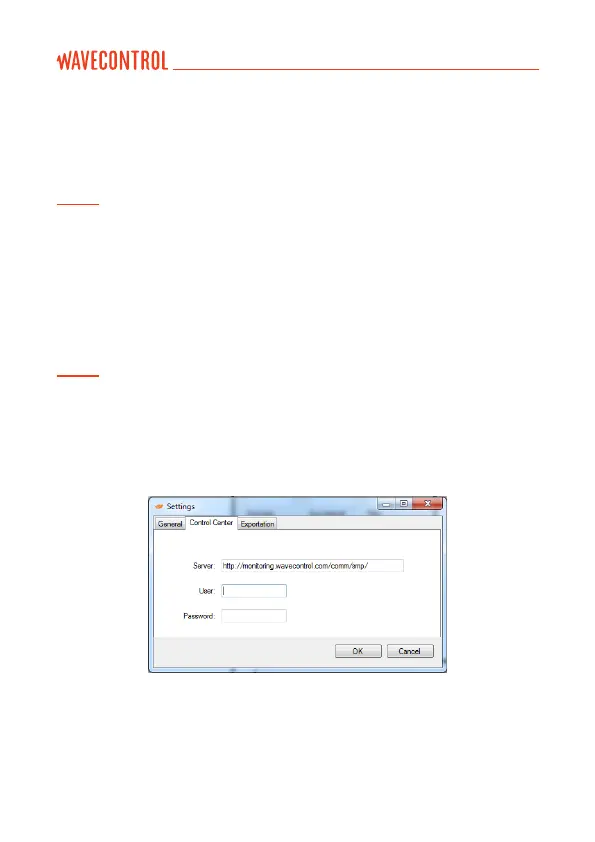
Make sure that you have entered a valid URL, a user name and a password in
the Settings menu (see Figure 16).
In the measurements screen, rst click on the measurement to upload the
data, then click on “Send to Control Centre”.
Figure 16: Settings screen
User’s Manual Electromagnetic Field Meter SMP2 P. 53