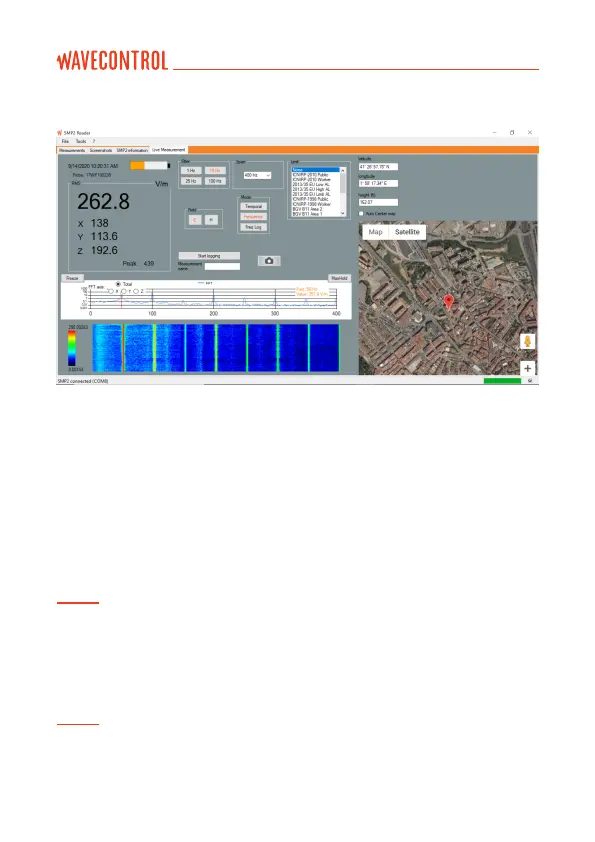
At the top on the left you will see the instantaneous eld value for each axis
and, depending on which probe you are using, several options to change
measurement parameters.
You can start or stop logging data and take screenshots.
In the frequency mode, you will see a graph with the FFT of the signal. Click on
the graph to position the cursor, which will show the value for that frequency.
Note: With the Control button pressed, you can also use the arrows on the keyboard
to move the cursor on the graph in the same way as the arrows of the SMP2 keypad.
When the GPS is switched on with a xed position, a map will show the
position of the SMP2 (this requires an Internet connection).
Note: The software in live measurement mode is not compatible with the spatial
average mode. You cannot launch a measurement in that mode.
Figure 18: live screen
User’s Manual Electromagnetic Field Meter SMP2 P. 55