<3. Converter menu>
3-5
IM 12A01F01-03EN 2nd Edition : Feb. 19, 2019-00
3.2 Trend
Home/Main screen > > Converter menu> > Trend
Y
C
O
A
F
X
G
L
B
Time
Maximum
Average
Minimum
Measurement value
Figure 3.4 Trend (sample image)
A: Drop-down list, select a data you want to display on Trend.
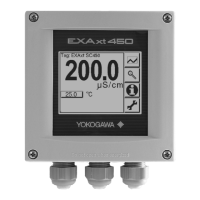
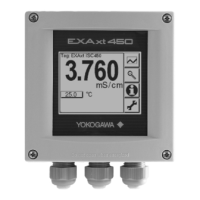
B: Current process value, unit
C: Trend (Max., Average, Minimum process value of each time interval)
X: X-axis: time period (user settable scale: 15 minutes to 14 days)
Y: Y-axis: measurement (user settable) *1
F: Clock (at the left end), the value varies according to user-set X-axis
G: Current time (at the right end)
L: “Home” (to Home screen)
O: Return (go back to a previous page)
“Trend” shows graphical mode in which the average measured value is shown on a time scale.
The live value is also digitally displayed in a text box.
To set the time scale (X-axis) and the measurement value scale (Y-axis), go to
> Converter menu > “Setting” > “Converter settings” > Trend. (See 4.5.3)
The screen displays the trend of up to 40 averages of the measurement for each time interval.
FLXA402 samples the measurements every second. The trending graphic also shows the
maximum, minimum and average values measured every 22.5 seconds. Time interval of each
data point is changed along with the time scale.
For example, if the time scale is set to 4 hours, the graphic shows the trend of the past 4 hours
prior to the actual measurement. Each point on the trend line represents the average over
4×60×60/40 =360 measurements (seconds).
NOTE
Updating the trend screen setup resets the current trend graph and starts a new one.

 Loading...