<10. Other Functions>
10-8
IM 11M12G01-02EN 1sh Edition : Mar. 25, 2021-00
Table 10.3 Trend graph setting
selectable item Description
Oxygen concentration The graph shows the oxygen concentration during measurement.
Humidity The graph shows the moisture content during measurement.
Mixing ratio The graph shows the mixing ratio during measurement.
Relative Humidity The graph shows the relative humidity during measurement.
Output item 1 The graph shows the item select as Output item 1.
an oxygen concentration graph.
Output item 2 The graph shows the item select as Output item 2.
an oxygen concentration graph.
(3) Select “Graph Sample Time” to Display the selectable sample time. Select the desired
Display item from this menu.
Selectable sample time: 15 minutes, 30 minutes, 1 hour, 2 hours, 4 hours, 8 hours, 24
hours, 7 days, 14 days.
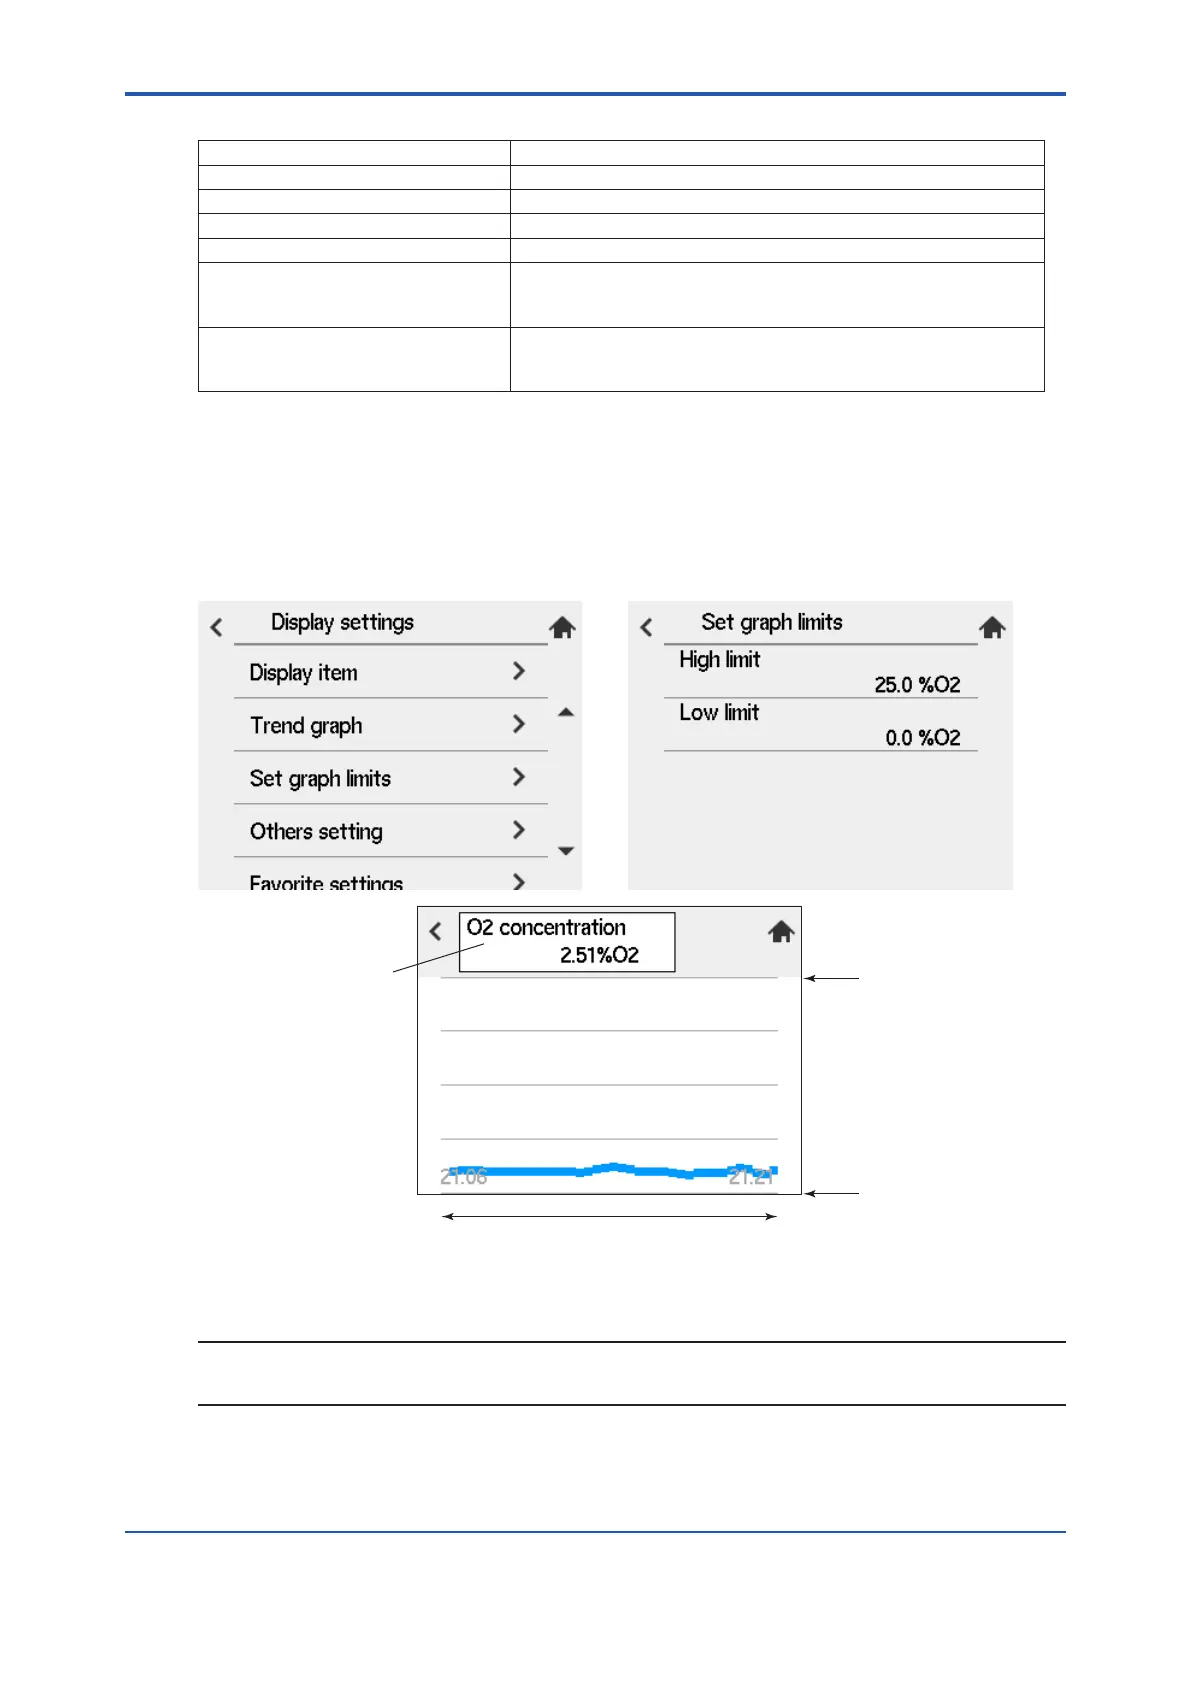
(4) “Converter Menu” > “Maintenance” > “Display settings” > “Set graph limits”.
Setup the Hi and Low limits respectively. Tapping the graph area displays the scale of the
vertical axis.
Graph selection items and
current mesured value
Graph sample time
High limit
Low limit
Figure 10.13 Trend graph
NOTE
If a rapid change in the measured value occurs during sampling, no sampled data are plotted on
the graph. Use the graph indication tentatively. Check the output current for accurate data
 Loading...